Create Interactive Maps with Angular and OpenLayers
The useful part
Design the whole workflow: data, selection, permissions and recovery. A map becomes useful when it works with the rest of the application.
Angular applications often need map views for operational dashboards, asset tracking, geospatial forms and field workflows. A useful map needs to work with the rest of the product: its data, permissions, forms and application state.
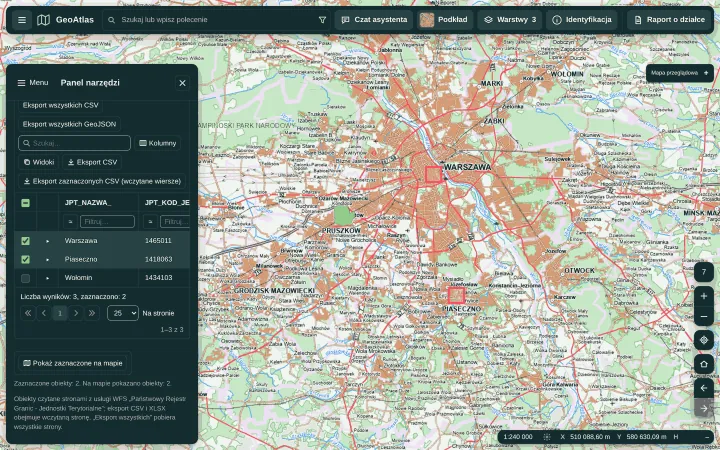
OpenLayers provides the mapping engine. In my own work, the map lives in a separate Angular library that the application only composes — the approach behind GeoAtlas, a map portal I built on shared UI and map libraries.
Start with the workflow
Before choosing layers or controls, describe what someone needs to do on the map. Finding an asset, selecting a feature and editing a boundary each need different interactions, feedback and validation.
Identify the data sources, expected feature count, coordinate systems and permissions early. These decisions shape the integration more than the appearance of the first map.
Compose the map with Angular
A map has a useful hierarchy: a view, layers, sources, features, styles and interactions. Angular components can express that structure while inputs and outputs connect the map to the surrounding application.
- Keep map configuration close to the feature that owns it.
- Use stable feature identifiers to connect map selections with forms and panels.
- Define which changes come from application state and which originate from a map interaction.
- Keep access to the mapping engine at a clear boundary for specialized behavior.
Example: one selection, three views
A user chooses a municipality in a table. The application stores its stable ID, highlights the matching feature on the map and opens the same record in the details panel. Clicking the map updates that same selection state.
- Load permitted records and retain their IDs when converting them to map features.
- Send map clicks and table selections through one selection action.
- When data refreshes, reconcile IDs against available records rather than comparing old feature objects.
Acceptance check: select a row, reload the source and switch to the detail panel. The same record stays selected, or the UI explains that it is no longer available. Define the behaviour when a filter hides the selected row.
Keep spatial data and application state clear
A selected feature can appear on a map, in a table and in a detail panel at the same time. Give that selection one owner so each view stays consistent when the user moves between them.
Define coordinate systems at the data boundary. Longitude and latitude, map display coordinates and the coordinates expected by your API may differ. Make transformations explicit and avoid repeatedly transforming the same geometry.
Plan for lifecycle and rendering
The interactive map depends on browser APIs. In an application that renders pages on the server, render the surrounding content first and initialize the map in the browser.
Give the map a visible container, handle size changes and release listeners and other resources when the view is destroyed. Check what happens when someone navigates away and returns, opens a panel or switches between application tabs.
Map tiles and other external data sources also have their own attribution and usage requirements. Keep the required attribution visible and choose providers that suit your application.
Make editing part of the product
Drawing geometry is only one step in an editing workflow. Decide how users save, cancel, undo and recover from an unsuccessful request. Keep an editable draft separate from confirmed server data.
Selection, snapping, validation and permissions should work together. A useful first implementation follows one complete workflow from loading the data to saving a valid change.
Bring your integration into focus
We can review your Angular version, data sources and required interactions together, then decide where the map logic should live: in the application, in a shared library or behind a service boundary.
Support can range from an architecture review and a plan to the delivery of one stage — a map integration, an editing workflow or a data-heavy screen around the map — and ongoing work with your team.
Continue with state and lifecycle of maps in Angular with OpenLayers. See how these decisions play out in a complete product in the GeoAtlas case study, or tell me about your application.
For the underlying mapping engine, see the OpenLayers documentation.
Sources and scope
The selection scenario is an illustrative acceptance check. The screenshot comes from the same documented capture used in the case study.