Projections · Angular, React and OpenLayers
Immediate rendering in geographic coordinates
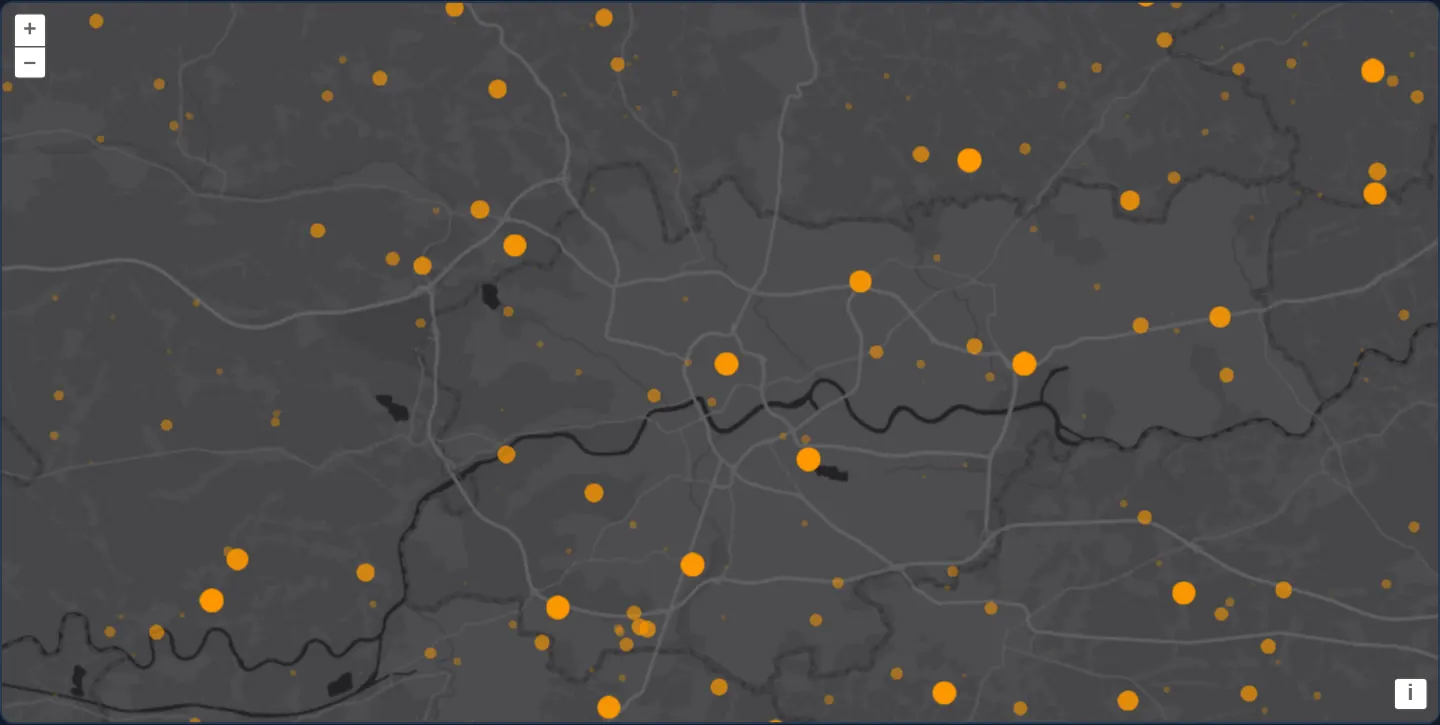
Draw 1,000 age-faded orange points in WGS84 degrees on every animation frame in OpenLayers using getVectorContext() and useGeographic().
What this example shows
Over Esri’s World Dark Gray basemap around Kraków, a rolling stream of 1,000 orange point flashes appears directly in [longitude, latitude] coordinates—newest arrivals glowing large and bright while older points shrink and fade away smoothly at full display frame rate.
When you need it
High-rate geographic telemetry—lightning detections, packet traces or sensor pings arriving natively in WGS 84 degrees—can bypass Feature and VectorSource overhead completely when drawn straight onto a layer canvas.
Combining OpenLayers’ immediate rendering API with useGeographic() lets per-frame canvas code pass raw degree geometries without manual fromLonLat calls.
The code
The example uses cc-openlayers, my Angular component library for OpenLayers: each aol-… element creates the OpenLayers object it names, updates it from its inputs and disposes of it with the component.
immediate-geographic.shared.tsimport { upAndDown } from 'ol/easing.js';
import Point from 'ol/geom/Point.js';
import { getVectorContext } from 'ol/render.js';
import type RenderEvent from 'ol/render/Event.js';
import Circle from 'ol/style/Circle.js';
import Fill from 'ol/style/Fill.js';
import Style from 'ol/style/Style.js';
/** The area the points appear in, around Kraków: [west, south, east, north] in degrees. */
const AREA = [19.45, 49.9, 20.43, 50.23];
/** The centre of the map, in longitude and latitude. */
export const CENTER = [19.94, 50.065];
/** A random point in `AREA`, in longitude and latitude. */
export function randomPoint(): Point {
const [west, south, east, north] = AREA;
return new Point([west + (east - west) * Math.random(), south + (north - south) * Math.random()]);
}
/** The circle every point is drawn as; each frame sets its opacity and scale. */
export const image = new Circle({
radius: 8,
fill: new Fill({ color: 'rgb(255, 153, 0)' }),
});
/** The style that carries the circle. */
export const style = new Style({
image: image,
});
/** The number of points kept. */
export const n = 1000;
/** Draws `geometries` by age, then replaces the oldest with a new random one. */
export function drawPoints(event: RenderEvent, geometries: Point[]): void {
const vectorContext = getVectorContext(event);
for (let i = 0; i < n; ++i) {
const importance = upAndDown(Math.pow((n - i) / n, 0.15));
if (importance < 0.1) {
continue;
}
image.setOpacity(importance);
image.setScale(importance);
vectorContext.setStyle(style);
vectorContext.drawGeometry(geometries[i]);
}
geometries.push(randomPoint());
geometries.shift();
}immediate-geographic.tsimport { ChangeDetectionStrategy, Component, DestroyRef, inject, viewChild } from '@angular/core';
import type Point from 'ol/geom/Point';
import { clearUserProjection, useGeographic } from 'ol/proj';
import type RenderEvent from 'ol/render/Event';
import {
DefaultControlComponent,
DefaultInteractionComponent,
LayerTileComponent,
MapComponent,
SourceImageTileComponent,
ViewComponent,
} from 'cc-openlayers';
import { CENTER, drawPoints, n, randomPoint } from './immediate-geographic.shared';
/**
* A thousand points around Kraków drawn on every frame with the immediate rendering API, in geographic coordinates:
* after the base layer renders, `getVectorContext` draws each point, sized and faded by its age, and the oldest point
* gives way to a new random one.
*/
@Component({
selector: 'app-immediate-geographic',
imports: [
DefaultControlComponent,
DefaultInteractionComponent,
LayerTileComponent,
MapComponent,
SourceImageTileComponent,
ViewComponent,
],
changeDetection: ChangeDetectionStrategy.OnPush,
template: `
<aol-map height="480px">
<aol-interaction-default />
<aol-control-defaults />
<aol-view [center]="center" [zoom]="11" />
<aol-layer-tile [postrender]="draw">
<aol-source-imagetile
url="https://server.arcgisonline.com/ArcGIS/rest/services/Canvas/World_Dark_Gray_Base/MapServer/tile/{z}/{y}/{x}"
[maxZoom]="16"
attributions="Tiles © Esri — Esri, HERE, Garmin, © OpenStreetMap contributors, and the GIS user community"
/>
</aol-layer-tile>
</aol-map>
`,
})
export class ImmediateGeographic {
protected readonly center = CENTER;
/** The points from the oldest to the newest. */
readonly geometries: Point[] = Array.from({ length: n }, randomPoint);
private readonly map = viewChild.required(MapComponent);
constructor() {
useGeographic();
inject(DestroyRef).onDestroy(clearUserProjection);
}
protected readonly draw = (event: RenderEvent): void => {
drawPoints(event, this.geometries);
this.map().instance.render();
};
} The React version uses the library's React adapter, cc-openlayers/react: each component creates the OpenLayers object it names when it mounts, updates it from its props and disposes of it when it unmounts.
immediate-geographic.react.tsximport { useEffect, useRef, useState } from 'react';
import type Point from 'ol/geom/Point.js';
import type OLMap from 'ol/Map.js';
import { clearUserProjection, useGeographic as setGeographicUserProjection } from 'ol/proj.js';
import type RenderEvent from 'ol/render/Event.js';
import { DefaultControls, DefaultInteractions, ImageTileSource, Map, TileLayer, View } from 'cc-openlayers/react';
import { CENTER, drawPoints, n, randomPoint } from './immediate-geographic.shared';
/**
* A thousand points around Kraków drawn on every frame with the immediate rendering API, in geographic coordinates:
* after the base layer renders, `getVectorContext` draws each point, sized and faded by its age, and the oldest point
* gives way to a new random one.
*/
export function ImmediateGeographic() {
const map = useRef<OLMap>(null);
/** The points from the oldest to the newest. */
const [geometries] = useState<Point[]>(() => Array.from({ length: n }, randomPoint));
// The view reads the user projection as it mounts, before any passive effect runs; StrictMode clears it with the
// first effect's cleanup, so the effect sets it again.
useState(setGeographicUserProjection);
useEffect(() => {
setGeographicUserProjection();
return clearUserProjection;
}, []);
const draw = (event: RenderEvent): void => {
drawPoints(event, geometries);
map.current?.render();
};
return (
<Map ref={map} height="480px">
<DefaultInteractions />
<DefaultControls />
<View center={CENTER} zoom={11} />
<TileLayer onPostRender={draw}>
<ImageTileSource
url="https://server.arcgisonline.com/ArcGIS/rest/services/Canvas/World_Dark_Gray_Base/MapServer/tile/{z}/{y}/{x}"
maxZoom={16}
attributions="Tiles © Esri — Esri, HERE, Garmin, © OpenStreetMap contributors, and the GIS user community"
/>
</TileLayer>
</Map>
);
}immediate-geographic.shared.tsimport { upAndDown } from 'ol/easing.js';
import Point from 'ol/geom/Point.js';
import { getVectorContext } from 'ol/render.js';
import type RenderEvent from 'ol/render/Event.js';
import Circle from 'ol/style/Circle.js';
import Fill from 'ol/style/Fill.js';
import Style from 'ol/style/Style.js';
/** The area the points appear in, around Kraków: [west, south, east, north] in degrees. */
const AREA = [19.45, 49.9, 20.43, 50.23];
/** The centre of the map, in longitude and latitude. */
export const CENTER = [19.94, 50.065];
/** A random point in `AREA`, in longitude and latitude. */
export function randomPoint(): Point {
const [west, south, east, north] = AREA;
return new Point([west + (east - west) * Math.random(), south + (north - south) * Math.random()]);
}
/** The circle every point is drawn as; each frame sets its opacity and scale. */
export const image = new Circle({
radius: 8,
fill: new Fill({ color: 'rgb(255, 153, 0)' }),
});
/** The style that carries the circle. */
export const style = new Style({
image: image,
});
/** The number of points kept. */
export const n = 1000;
/** Draws `geometries` by age, then replaces the oldest with a new random one. */
export function drawPoints(event: RenderEvent, geometries: Point[]): void {
const vectorContext = getVectorContext(event);
for (let i = 0; i < n; ++i) {
const importance = upAndDown(Math.pow((n - i) / n, 0.15));
if (importance < 0.1) {
continue;
}
image.setOpacity(importance);
image.setScale(importance);
vectorContext.setStyle(style);
vectorContext.drawGeometry(geometries[i]);
}
geometries.push(randomPoint());
geometries.shift();
}How the React version works
A thousand points around Kraków drawn on every frame with the immediate rendering API, in longitude and latitude, sized and faded by their age, over a dark Esri basemap.
What both versions share
OpenLayers renders the map and handles the interactions; the cc-openlayers/core layer gives both adapters the same view binding (MapViewBinding) and the same conversion of coordinates from EPSG:4326 to the map's projection. Both versions import the centre of the view, the area, randomPoint, the circle and its style, the number of points and the drawing loop drawPoints from the example's .shared.ts file, so the logic exists once. drawPoints(event, geometries) takes the points as an argument, so each version passes the array it keeps.
From Angular to React
| Angular | React |
|---|---|
useGeographic() in the constructor and clearUserProjection on destroy | useState(setGeographicUserProjection) and a useEffect that sets it again and returns clearUserProjection |
<aol-layer-tile [postrender]="draw"> | <TileLayer onPostRender={draw}> |
| the points in a class field | useState with an initialiser, so they are made once |
viewChild of the map and instance.render() | useRef<OLMap> on Map and map.current?.render() |
Who creates, updates and disposes
Map creates the ol/Map in useLayoutEffect and disposes of it on unmount; each layer, source and interaction component adds its object to the parent it gets from context and removes it in its effect's cleanup, as ngOnDestroy does in Angular. useGeographic becomes setGeographicUserProjection, called in a useState initialiser, because the view and the geometries read the user projection while they mount, before any effect runs. StrictMode runs the effect's cleanup (clearUserProjection) once at the start, so the effect sets the projection again; the cleanup also restores it on unmount, as DestroyRef.onDestroy does in Angular.
Architecture and OpenLayers mechanics
With useGeographic() active, randomPoint() generates Point geometries in decimal degrees inside AREA. On every tile-layer [postrender]="draw" pass, getVectorContext(event) projects those degree geometries to Web Mercator on the fly—adjusting a single shared circle style via image.setOpacity(importance) and image.setScale(importance) before vectorContext.drawGeometry(geometries[i]) (skipping points below 0.1).
Appending one new point (geometries.push(randomPoint())), dropping the oldest (geometries.shift()) and calling this.map().instance.render() drives the continuous animation.
How it works
[postrender]="draw"usesgetVectorContext(event)to paint directly onto the base tile layer’s canvas.useGeographic()letsrandomPoint()keep coordinates inAREAas decimal degrees while immediate drawing projects them to Web Mercator.- Mutating
image.setOpacity(importance)andimage.setScale(importance)beforevectorContext.drawGeometry(geometries[i])avoids per-point style allocations. geometries.push(randomPoint())andgeometries.shift()maintain a fixed-size 1,000-point ring buffer acrossthis.map().instance.render()frames.
Pitfalls
- Geometries painted via
getVectorContextexist only as canvas pixels—neither forEachFeatureAtPixel nor getFeaturesAtPixel can select or inspect them. - Requesting
render()at the end of everypostrenderkeeps the entire map (including basemap composition) running at 60+ fps continuously; pause the loop when the tab hides or streaming stops.
Related examples
The same feature in the OpenLayers examples .
Background: state and lifecycle of maps in Angular with OpenLayers, which the components of cc-openlayers take care of.