OpenLayers / Angular and React
OpenLayers examples in Angular and React
269 examples with two framework implementations, from the first map in a component to drawing, editing, data services, raster processing and WebGL.
I adapted OpenLayers examples into Angular and React, using the shared map library behind ClearCraft Geoportal. Each page includes a screenshot, source code and notes comparing the two implementations. Map previews include Kraków. The local cc-openlayers library is not a published package.
Background: state and lifecycle of maps in Angular.
Build a map application with meEssentials
33 examplesCreate the map, position and animate its view, limit its zoom and extent, and follow the pointer, the device and the map's events.
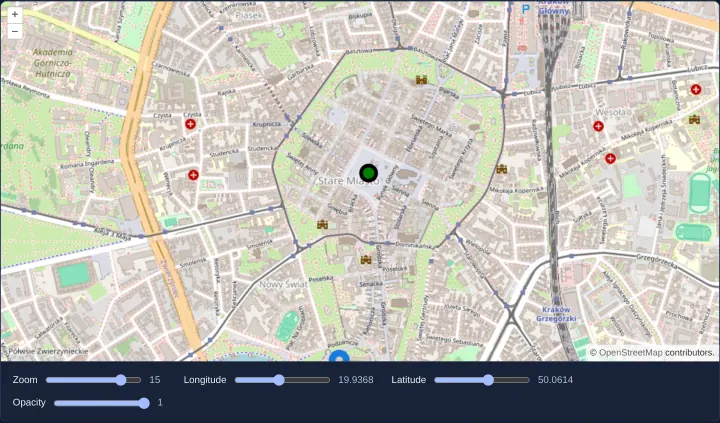
A map in an Angular component
Build a reactive OpenLayers map component in Angular and React: bind zoom, WGS84 center coordinates, layer opacity and vector markers with signals.
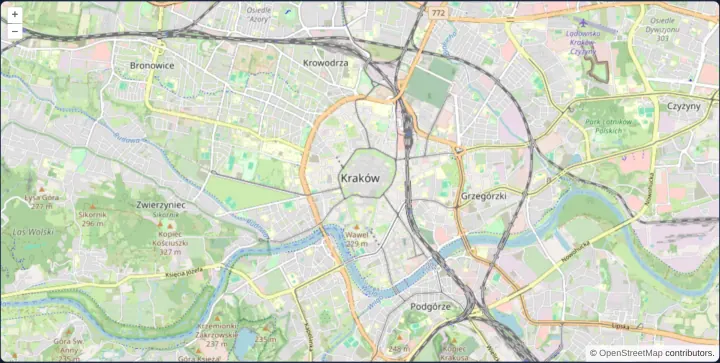
The smallest complete map
Create the smallest complete OpenLayers map in Angular and React with a sized container, Web Mercator view, OpenStreetMap tiles, controls and gestures.
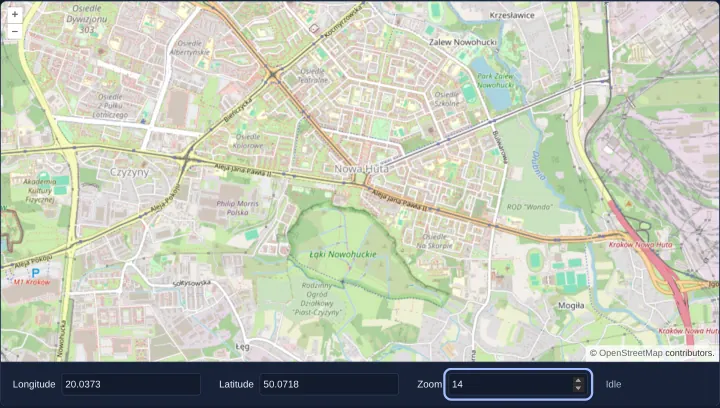
Map position in signals
Synchronize OpenLayers map center and zoom two-way with Angular signals or React state using number inputs, toLonLat conversion and moveend events.
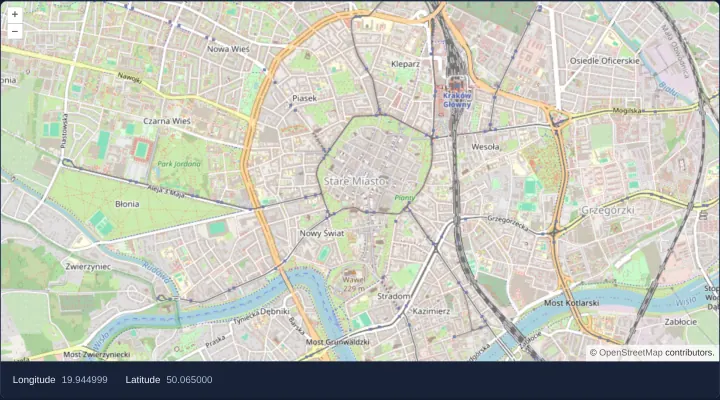
Cursor coordinates outside the map
Stream live WGS84 longitude and latitude under the pointer into UI elements outside an OpenLayers map using pointermove, toLonLat and signals.
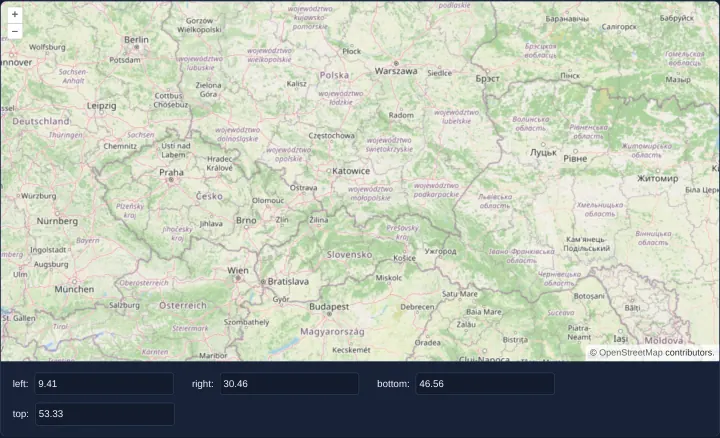
The map extent after every move
Compute the visible geographic bounding box (west, east, south, north) of an OpenLayers map after every pan or zoom using moveend and calculateExtent.
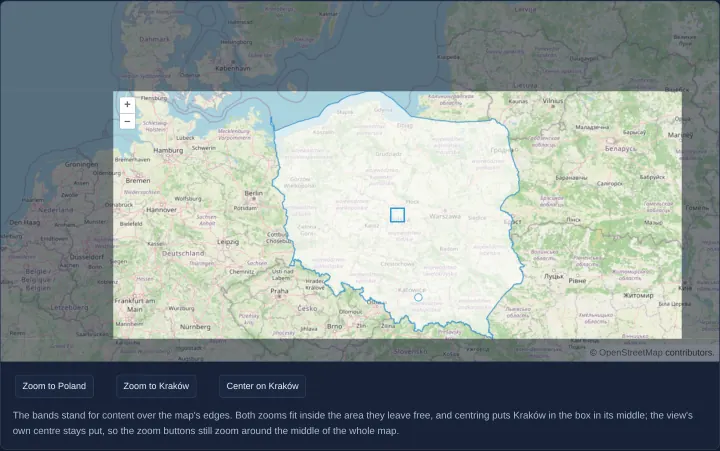
Fit a geometry into the free part of the map
Fit polygons or points into the uncovered area of an OpenLayers map using per-call fit padding, minResolution limits and pixel-accurate centerOn.
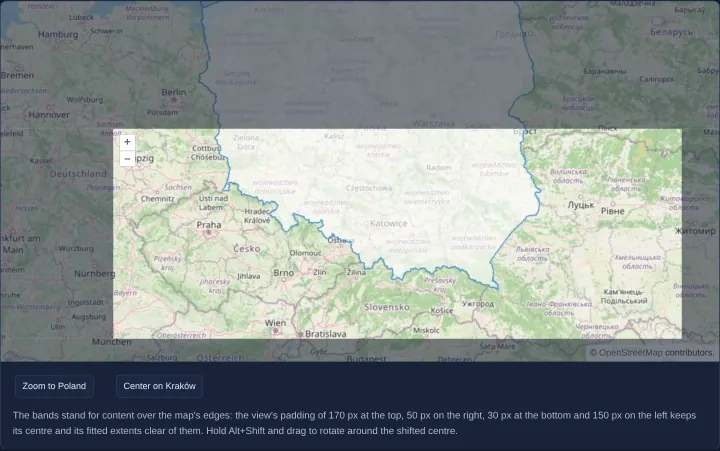
View padding for content over the map
Offset an OpenLayers view optical center permanently with the view padding option so fit, setCenter, zoom controls and rotation respect UI overlays.
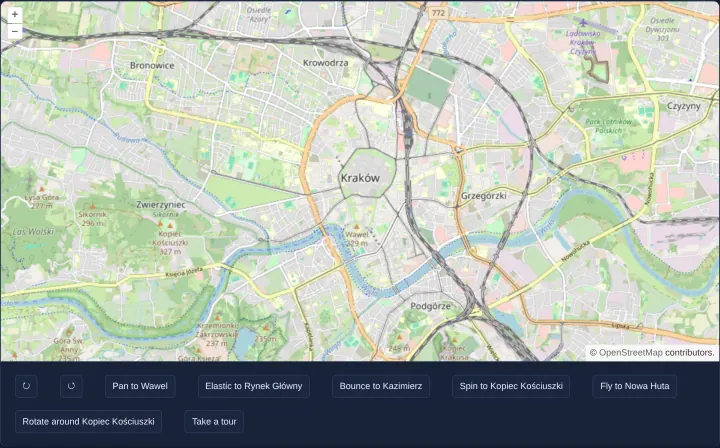
View animations: pan, zoom, rotate and fly
Build smooth OpenLayers camera transitions in Angular and React: easing pans, flyTo zoom-dip flights, anchor rotation and cancellable guided tours.
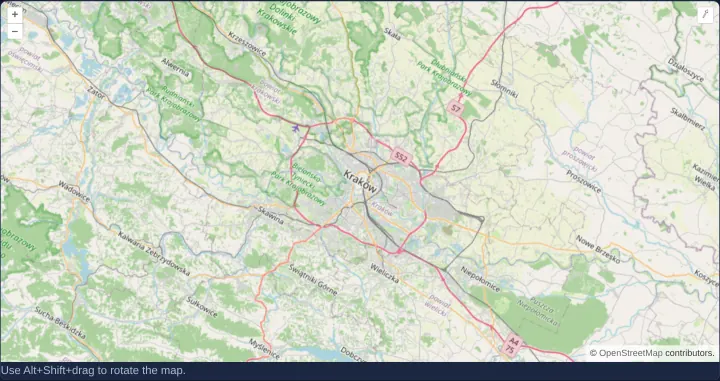
A rotated map view
Initialize a rotated OpenLayers map view in radians, rotate interactively with Alt+Shift drag or touch gestures, and snap back north with controls.
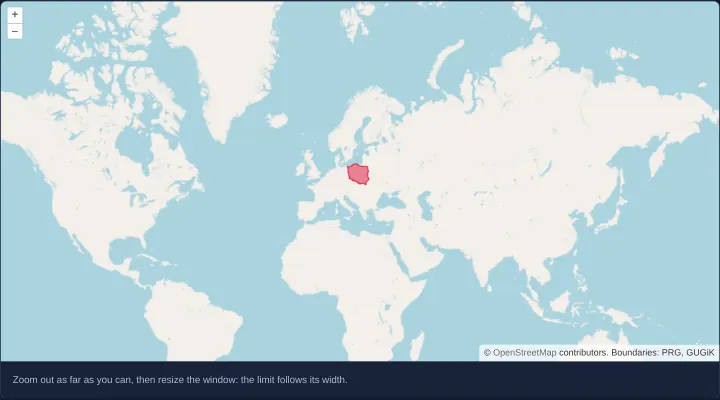
A minimum zoom that follows the width of the map
Compute OpenLayers minZoom dynamically from viewport width on initial render and resize so a world map fills every screen on crisp integer zoom levels.
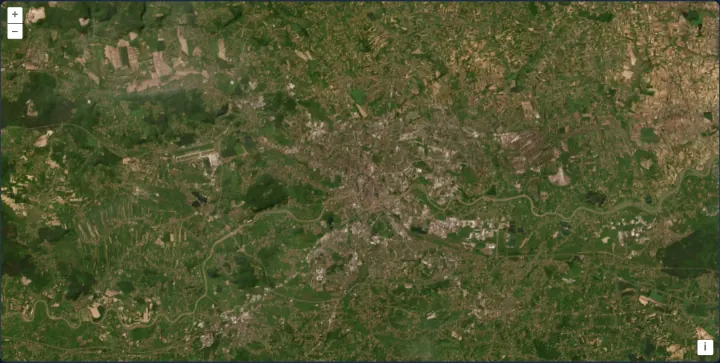
Zoom limits on a satellite map
Restrict OpenLayers camera zoom between minZoom and maxZoom over Esri World Imagery using an ArcGIS {z}/{y}/{x} image tile source and attributions.
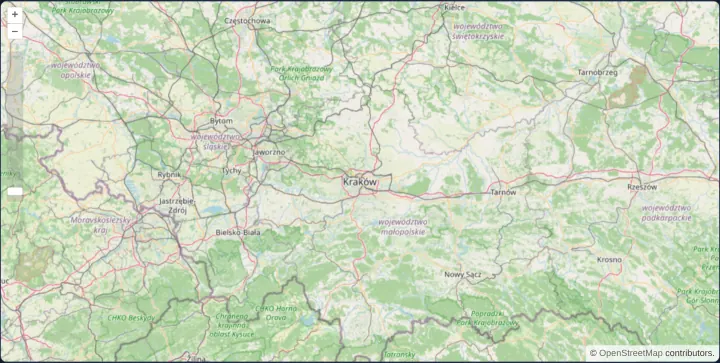
A view kept within Poland
Lock an OpenLayers map view inside Poland’s bounding box with the view extent constraint, a ZoomSlider control and document-wide keyboard navigation.
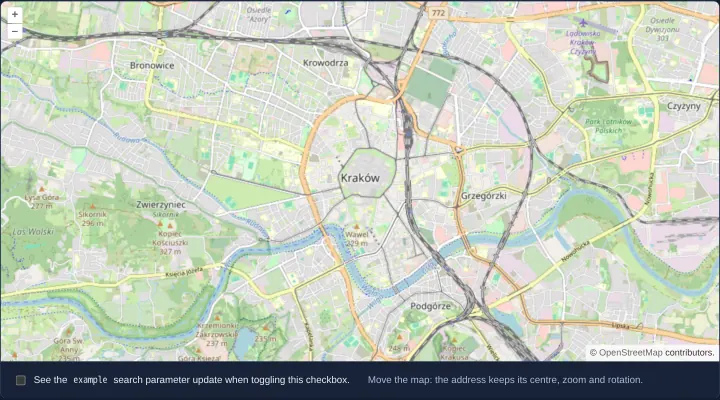
Map state in the URL with the link interaction
Persist OpenLayers map center, zoom, rotation, layer visibility and custom query parameters in the browser URL using the Link interaction.
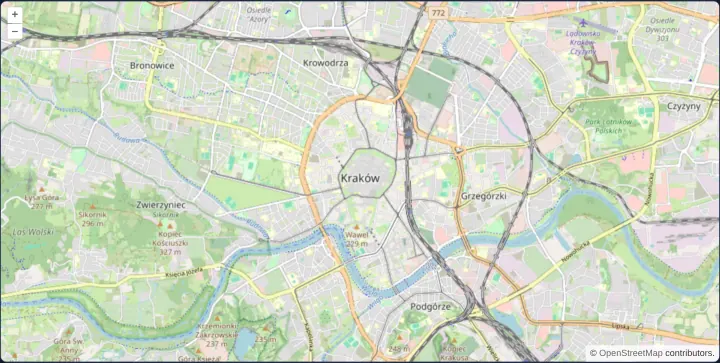
A permalink in the URL hash
Store and restore OpenLayers zoom, center and rotation in a custom #map=zoom/x/y/rotation URL hash using Angular Location and browser history.
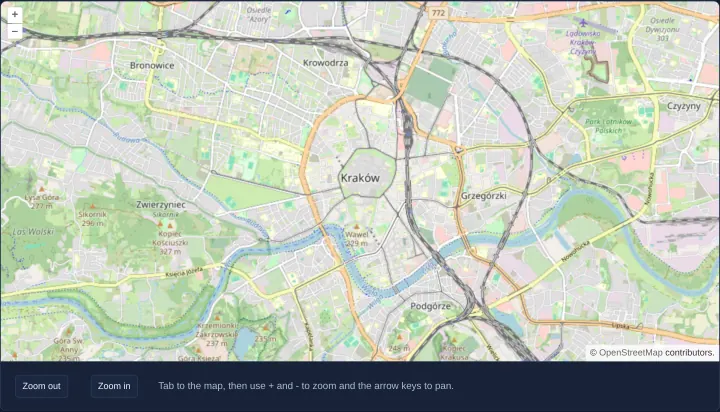
A map for keyboard and screen reader users
Build a WCAG-accessible OpenLayers map for keyboard and screen reader users with ARIA naming, Tab focus, arrow-key panning and external zoom buttons.
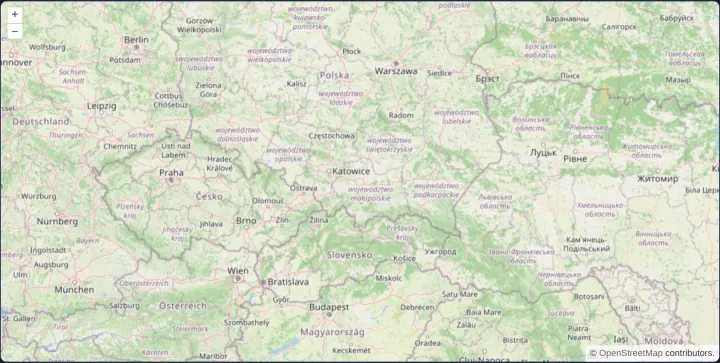
A map that lets the page scroll
Prevent an embedded OpenLayers map from hijacking mouse-wheel page scrolling until focused using onFocusOnly on the default interactions.
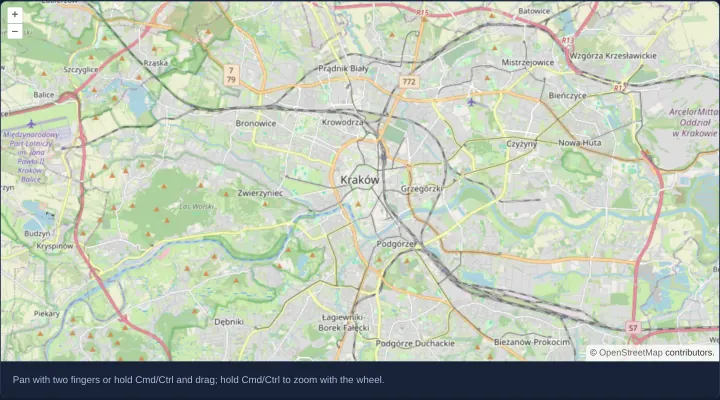
Two-finger panning in a scrolling page
Enable cooperative mobile two-finger panning and Cmd/Ctrl wheel zoom in OpenLayers so single-finger touch swipes and plain wheel events scroll the page.
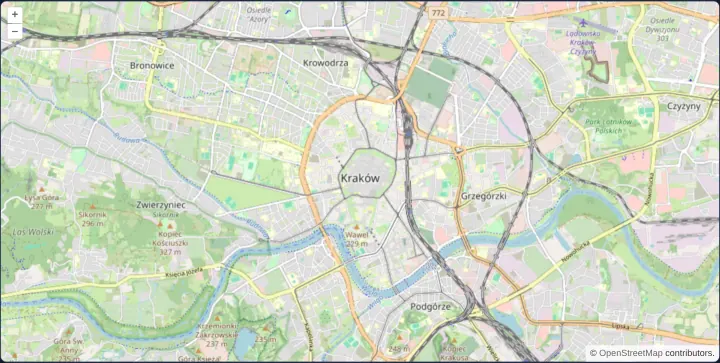
Whole zoom levels with constrainResolution
Snap OpenLayers pinch, wheel and button zooms to crisp integer tile levels with constrainResolution on the view to eliminate raster label blur.
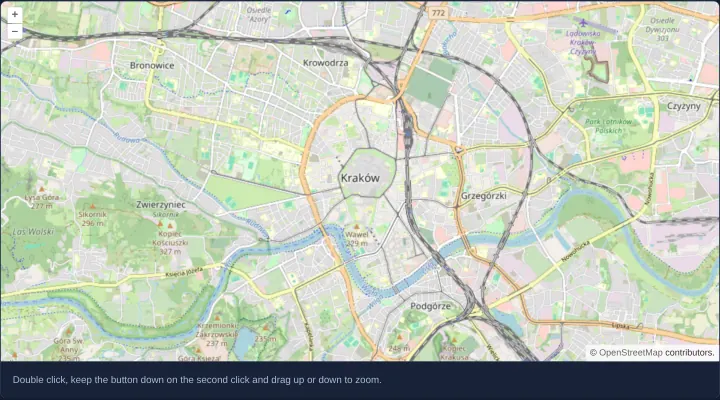
Zoom with a double click and drag
Add one-handed double-tap-and-drag zooming to an OpenLayers map in Angular and React with DblClickDragZoom ordered after default interactions.
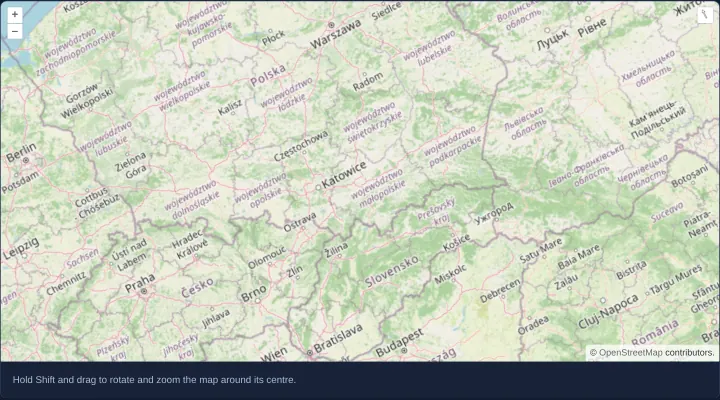
Rotate and zoom with Shift and drag
Rotate and scale an OpenLayers map around its centre in one Shift-and-drag mouse gesture with DragRotateAndZoom in Angular and React apps.
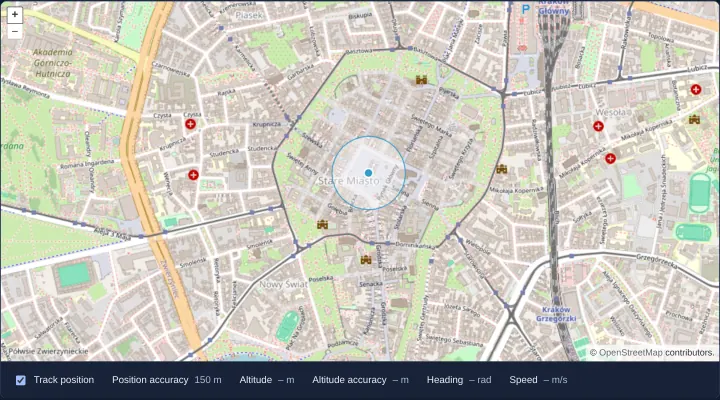
The user's position from the Geolocation API
Track browser GPS position on an OpenLayers map with an accuracy polygon and live altitude, heading and speed read-outs in Angular and React.
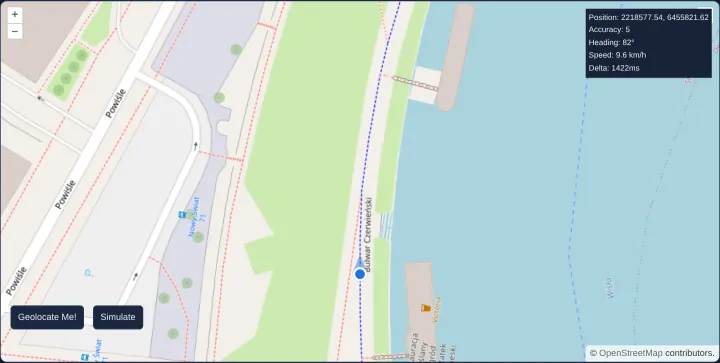
Follow the device with its heading up
Follow a moving device heading-up on an OpenLayers map with XYZM trajectory smoothing and a simulated bike ride along Kraków’s Vistula river.
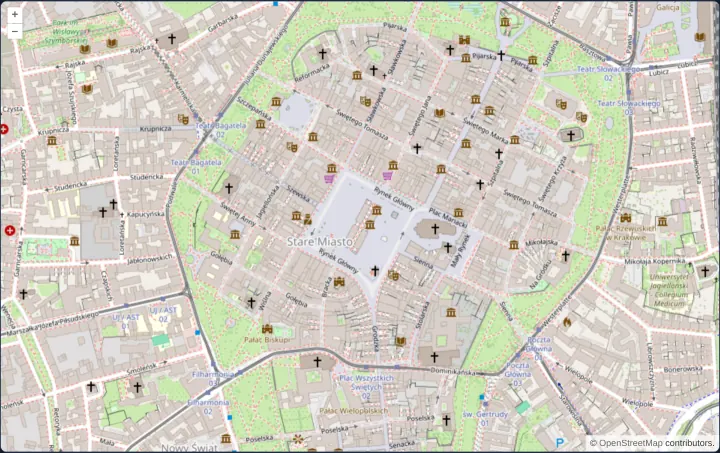
A full-screen map for phones
Fill mobile browser screens cleanly using a 100dvh OpenLayers viewport that centres on the first GPS fix at street level while allowing pans.
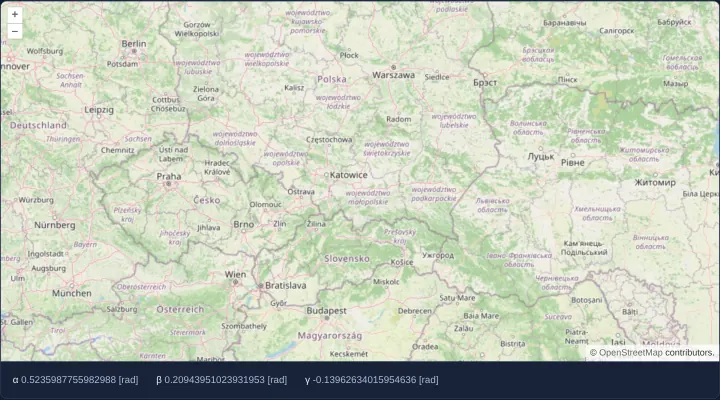
Move the map by tilting the device
Pan an OpenLayers map continuously by tilting a mobile device using alpha, beta and gamma orientation sensors and iOS Safari permission flow.
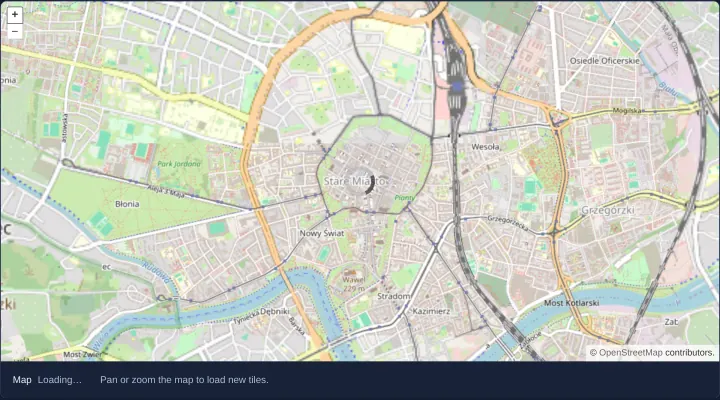
A loading spinner from the map's load events
Display a CSS loading spinner and accessible status text over an OpenLayers map using map-level loadstart and loadend events in Angular.
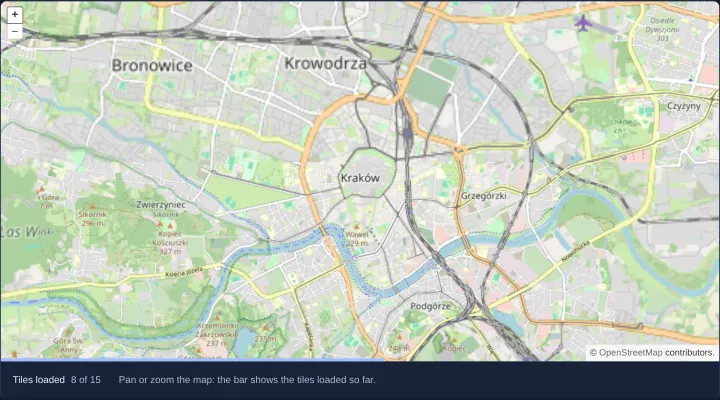
A tile loading progress bar
Build an accessible tile-loading progress bar for an OpenLayers map by counting tileloadstart, tileloadend and tileloaderror source events.
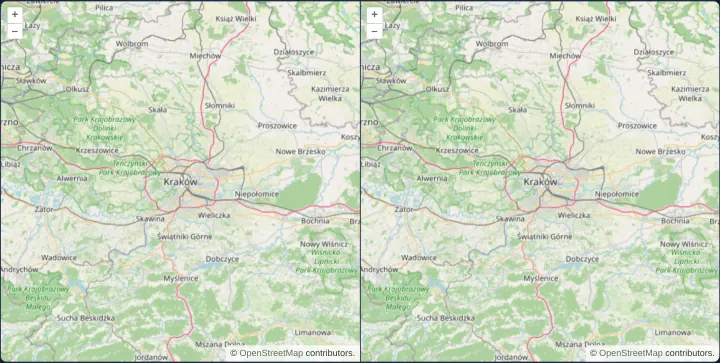
Preloading low-resolution tiles
Compare two synchronized OpenLayers maps sharing a single view to see how preloading coarse parent tiles prevents blank squares on zoom.
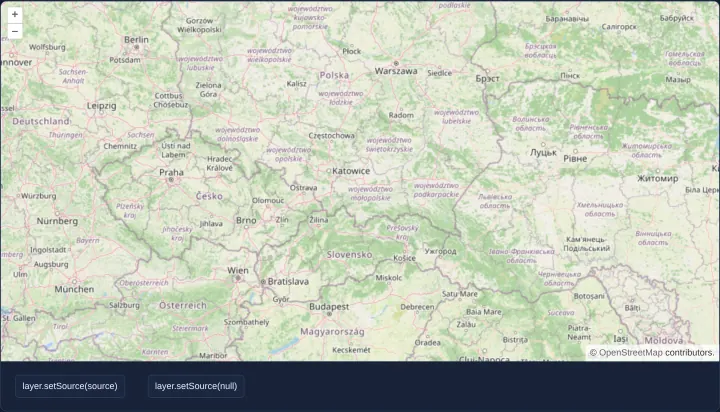
A layer whose source comes later
Attach and detach an OpenLayers tile source dynamically after startup using conditional rendering and setSource without losing layer order.
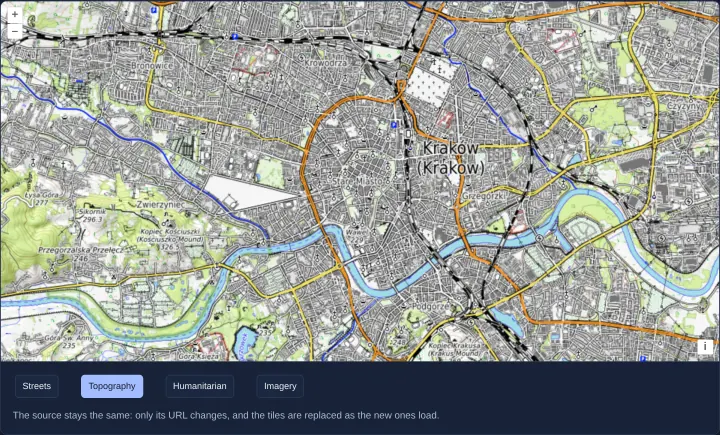
One tile source for four basemaps
Switch one WebGL XYZ tile source across four OpenLayers basemaps by updating URL and attributions live without destroying the tile layer.
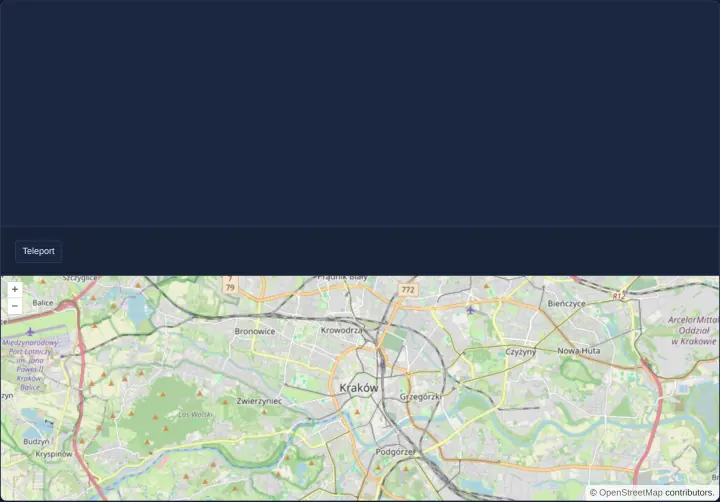
Move a map to another element
Move a live OpenLayers map instance between two DOM containers with setTarget while preserving its camera view, tile cache and map state.
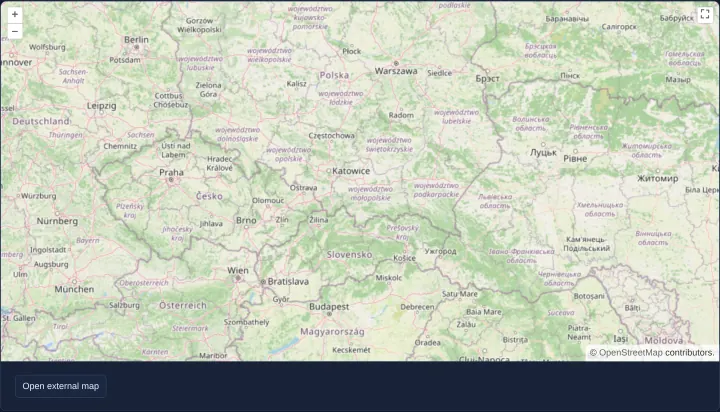
A map in a separate browser window
Move a live OpenLayers map into a separate multi-monitor browser popup window and back using window.open, setTarget and pagehide cleanup.
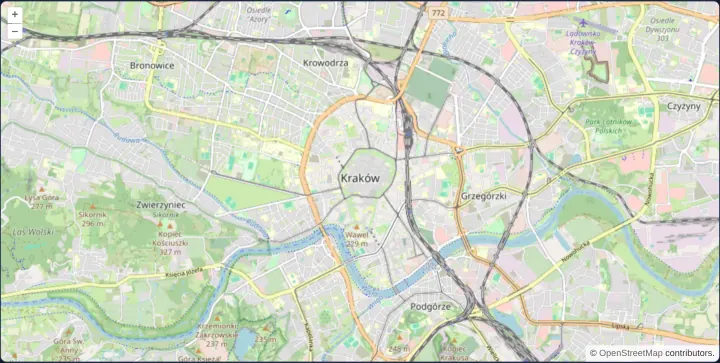
A map in a custom element
Encapsulate a reusable OpenLayers map inside a standard browser Custom Element with clean connect and disconnect lifecycles in Angular and React.
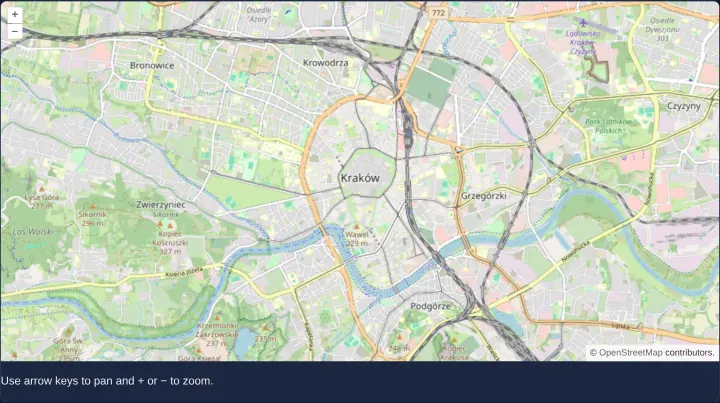
Keyboard navigation inside a custom element
Preserve accessible keyboard panning, zoom shortcuts and ARIA naming inside a Shadow DOM OpenLayers Custom Element in Angular and React apps.
Controls
13 examplesAttribution, scale line, full screen, zoom slider, overview map and graticule, and controls of your own.
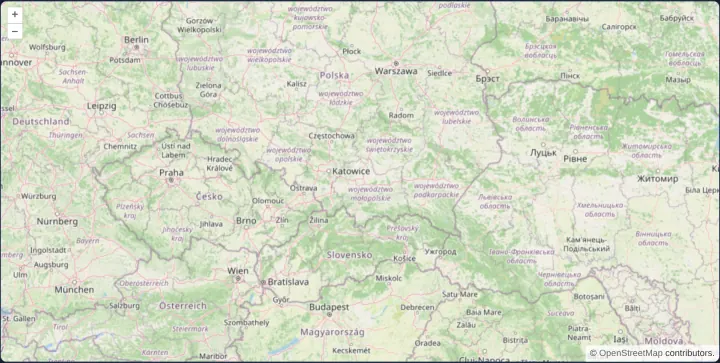
An attribution that folds on narrow maps
Keep OpenLayers attributions expanded on wide maps and collapse them automatically into a compact button below 600 pixels in Angular and React.
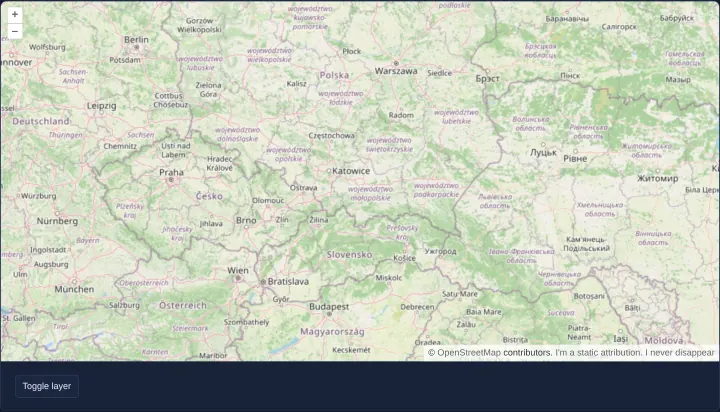
A static attribution that never disappears
Configure a persistent control-level attribution in OpenLayers that stays visible on the map even when every tile and vector layer is hidden.
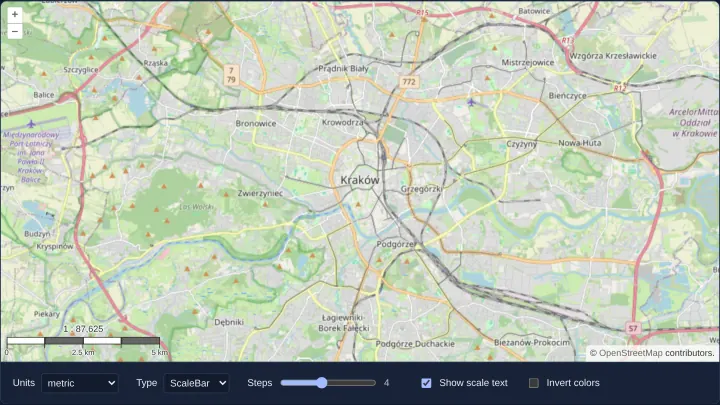
A scale line or a scale bar
Render an OpenLayers ScaleLine or segmented scale bar with 1 : N ratios across metric, imperial, US, nautical and degree units in Angular.
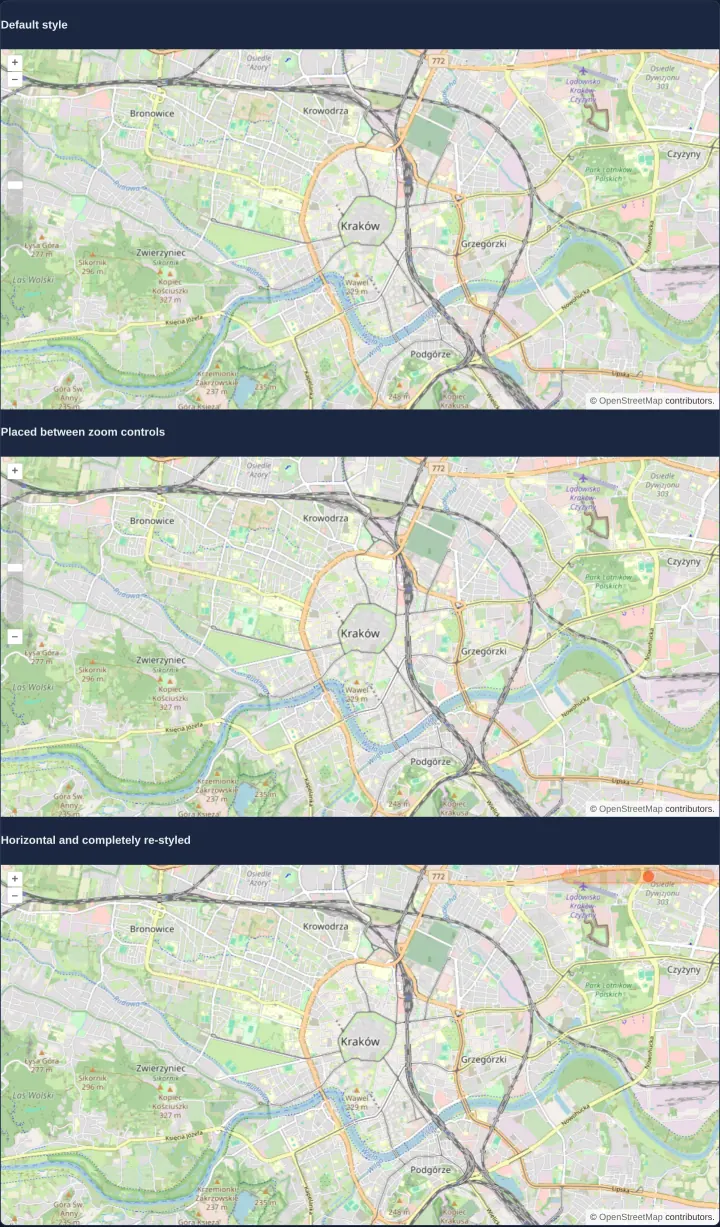
Zoom sliders in three styles
Style OpenLayers ZoomSlider controls in three map layouts: default vertical rail, tucked between zoom buttons, and a compact horizontal bar.
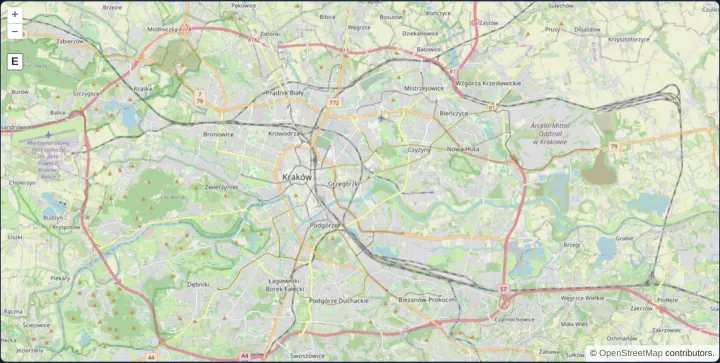
Zoom to an extent with a button
Add an OpenLayers ZoomToExtent control button below the zoom bar so one click fits the camera back to Kraków’s Web Mercator bounds anytime.
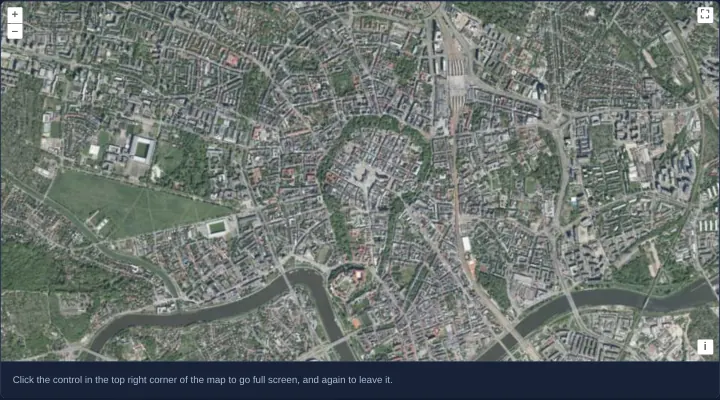
A full screen button
Add an OpenLayers FullScreen button over GUGiK WMTS orthophoto tiles of Kraków so the map expands to fill the screen and resizes cleanly.
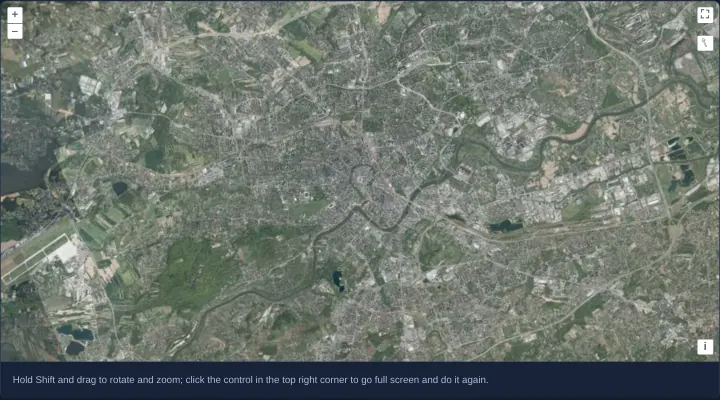
Rotate and zoom in full screen
Combine OpenLayers FullScreen control and Shift-drag DragRotateAndZoom over Kraków aerial imagery so desktop rotation works in full screen.
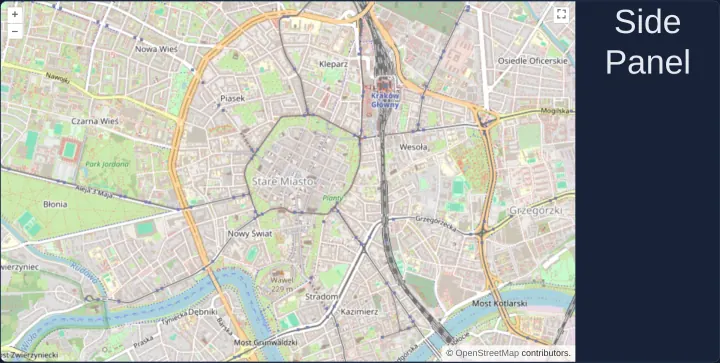
Full screen for a map and its side panel
Expand both an OpenLayers map and its companion side panel into browser full screen together by passing a shared wrapper ID as the source.
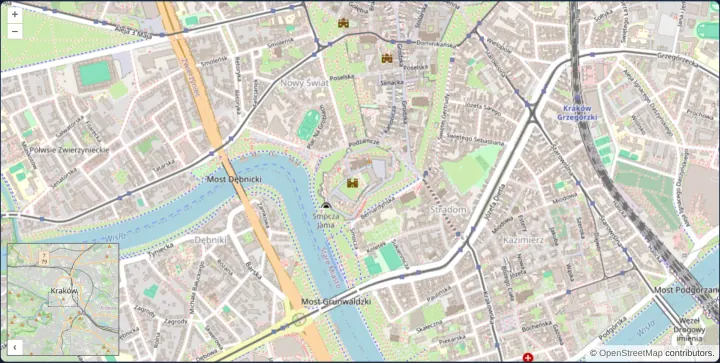
An overview map
Mount an expanded OpenLayers OverviewMap inset control with its own dedicated OpenStreetMap tile layer to frame the main viewport in context.
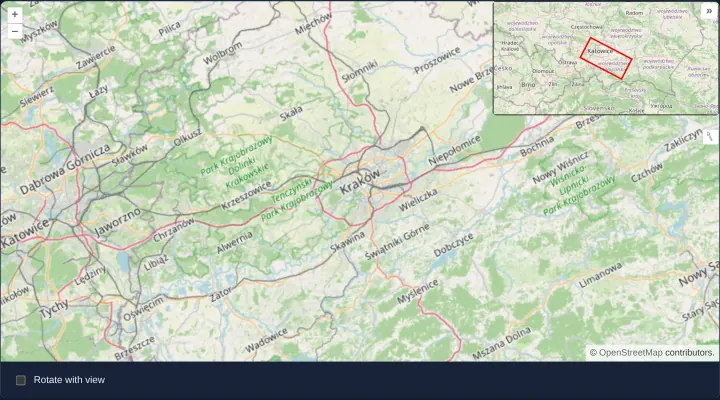
A styled overview map that rotates with the view
Customize an OpenLayers OverviewMap control with CSS classes, custom toggle labels and optional view-synchronized rotation in Angular apps.
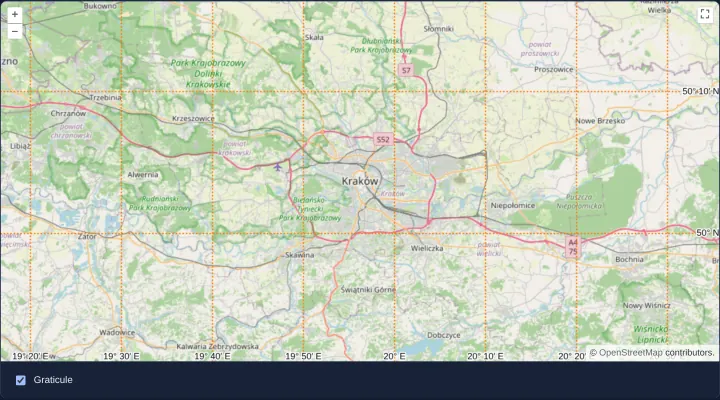
A graticule with labels
Overlay a toggleable OpenLayers coordinate graticule with degree-and-minute labels and custom dotted orange strokes over a Web Mercator map.
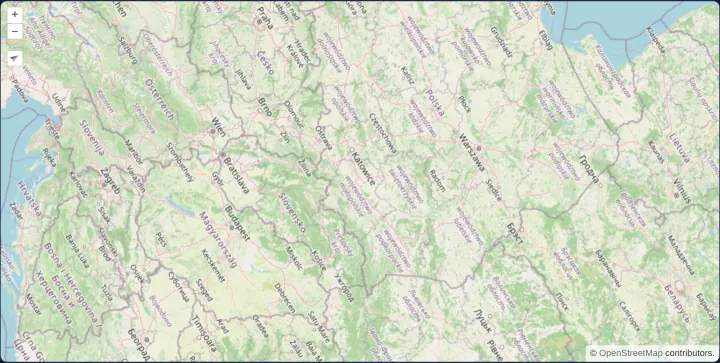
A custom control: rotate to north
Wrap Angular or React markup inside an OpenLayers Control to build an auto-hiding north-arrow button synchronized with live view rotation.
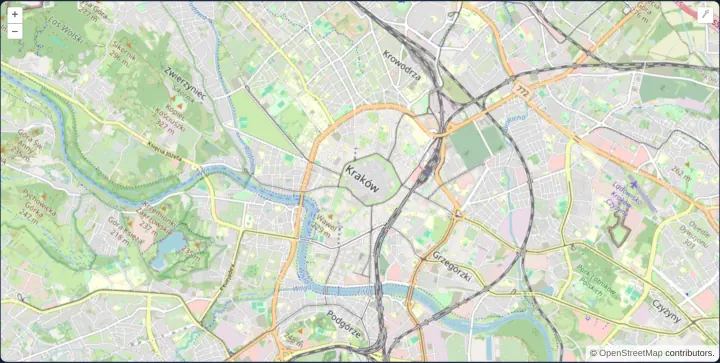
Tooltips on map controls
Attach and dispose Bootstrap tooltips on OpenLayers zoom and rotation control buttons for hover and keyboard focus in Angular and React apps.
Layers
21 examplesOpacity, order, groups, extents and zoom limits of layers, clipping, swipe and side-by-side comparison, and image layers.
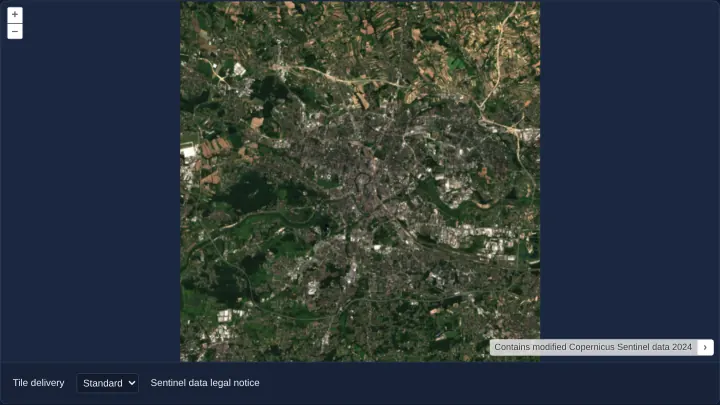
Zoomify image tiles
Display high-resolution pre-tiled imagery in OpenLayers with the Zoomify source and switch live between Standard (1x) and Retina (2x) tile delivery.
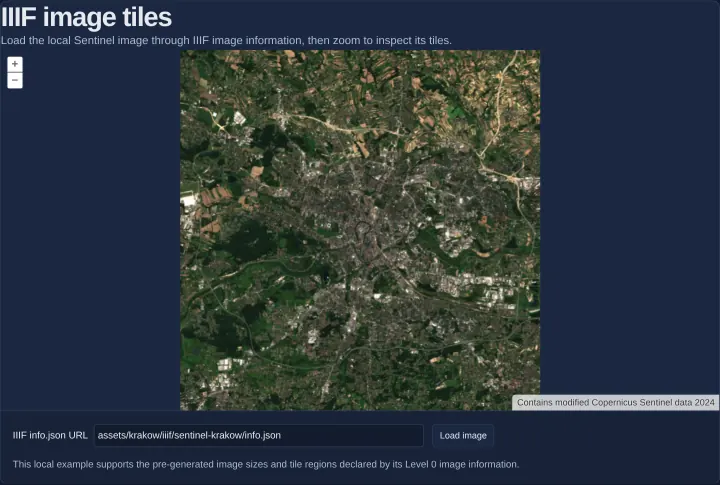
IIIF image tiles
Render static IIIF Image API tile pyramids in OpenLayers by parsing info.json metadata, fitting pixel extents and zooming Sentinel imagery.
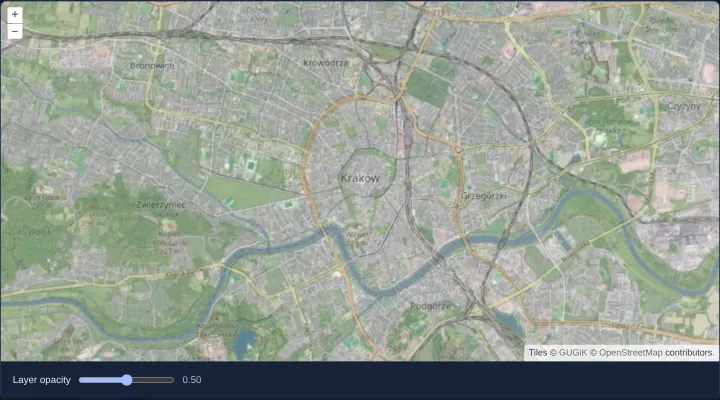
Change the opacity of a layer
Cross-fade OpenStreetMap over Kraków’s aerial orthophotomap using a reactive range slider bound to the opacity input of aol-layer-tile.
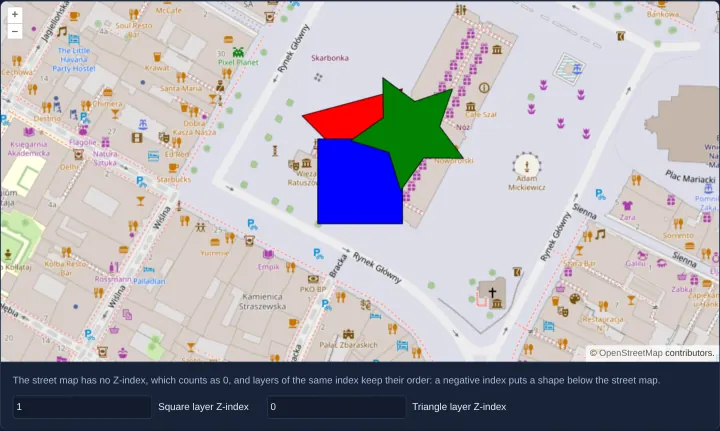
Order layers by Z-index
Control OpenLayers vector and raster stacking order dynamically with zIndex bindings while keeping an unmanaged setMap overlay pinned on top.
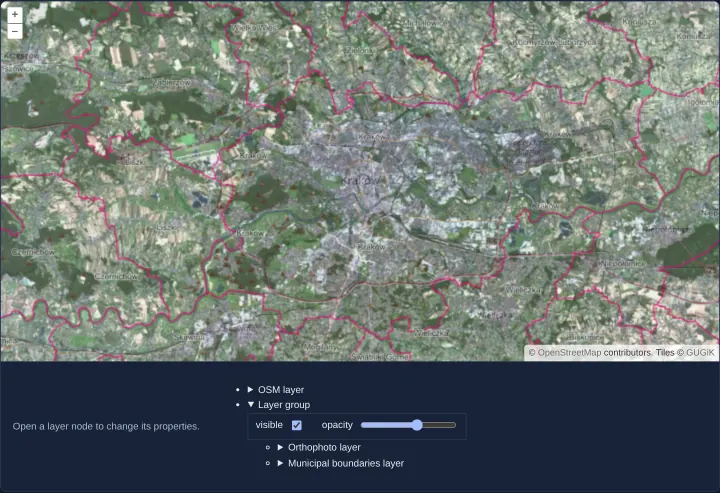
Group layers and set them together
Organize OpenLayers layers into a hierarchical LayerGroup tree and control combined visibility and multiplied opacity in Angular and React.
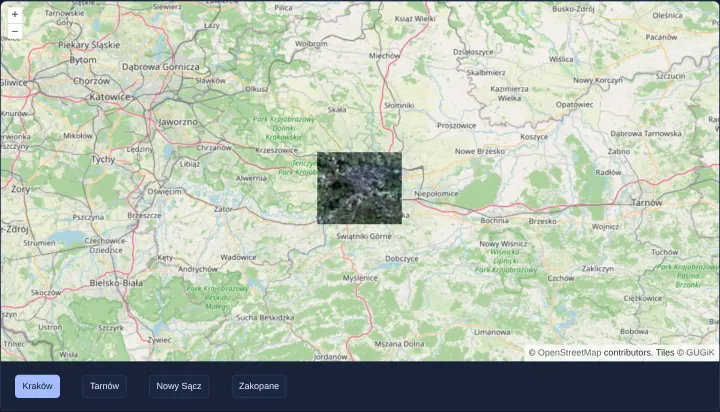
Limit a layer to an extent
Restrict an OpenLayers tile layer to a municipal bounding box with transformExtent so orthophoto tiles render and download only where needed.
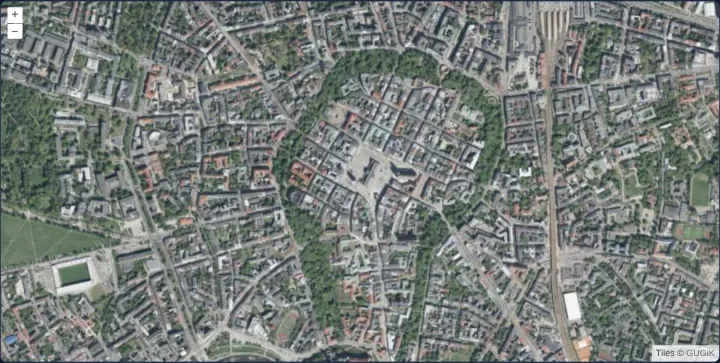
Switch layers by zoom level
Switch automatically between OpenStreetMap and aerial orthophotography at zoom 14 using exclusive minZoom and inclusive maxZoom on tile layers.
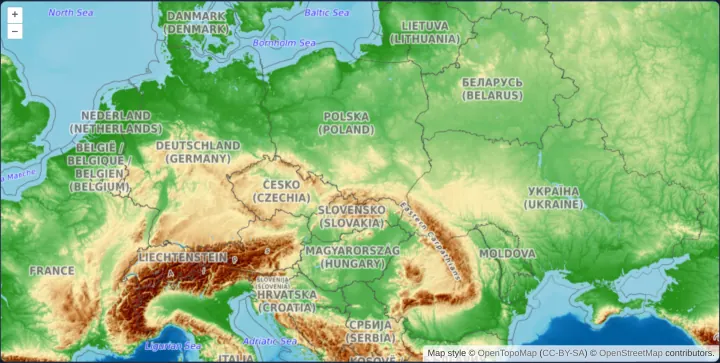
Switch layers by resolution
Control scale-dependent OpenLayers tile layers in map units per pixel using inclusive minResolution and exclusive maxResolution thresholds.
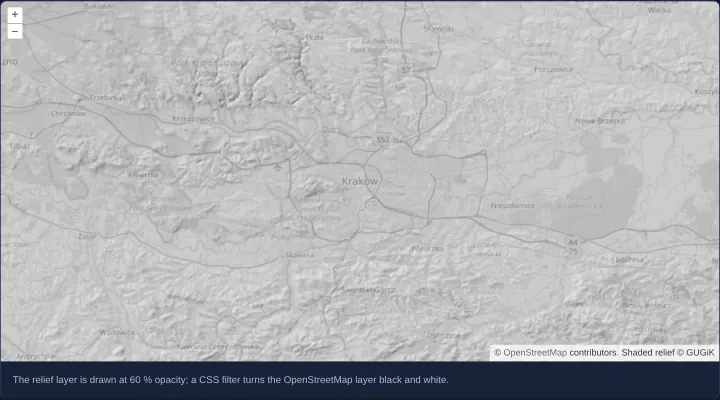
A semi-transparent layer over a grey map
Overlay translucent GUGiK shaded terrain relief at 60% opacity over a CSS-desaturated grayscale OpenStreetMap base layer in OpenLayers.
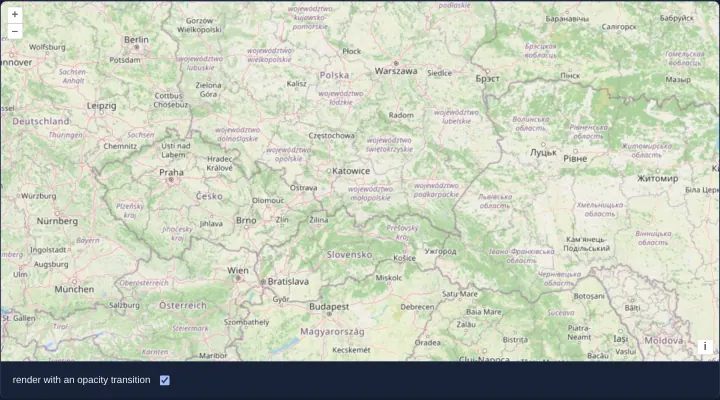
Fade tiles in, or show them at once
Compare OpenLayers’ default 250 ms tile opacity fade-in against instant zero-transition tile rendering using two toggleable OSM sources.
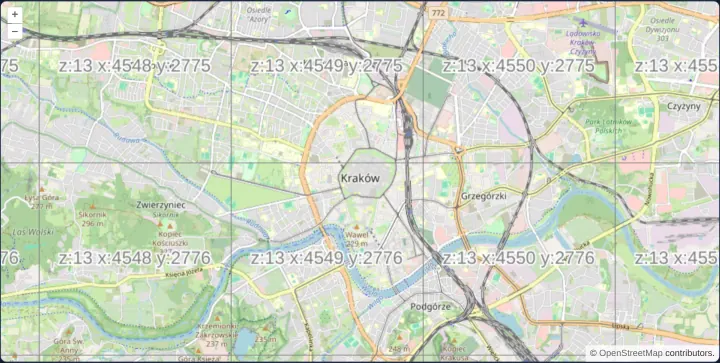
Show the tile grid and its coordinates
Overlay a browser-rendered OpenLayers TileDebug wireframe showing z, x and y XYZ tile coordinates directly over OpenStreetMap in Angular.
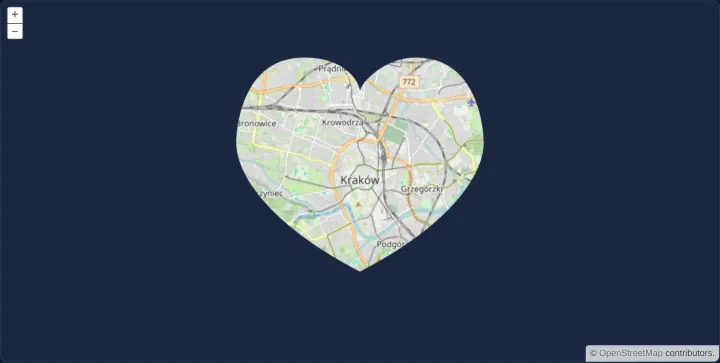
Clip a layer to a shape
Clip an OpenLayers tile layer to an upright, HiDPI-aware vector shape on the canvas using prerender clip paths, inversePixelTransform and postrender.
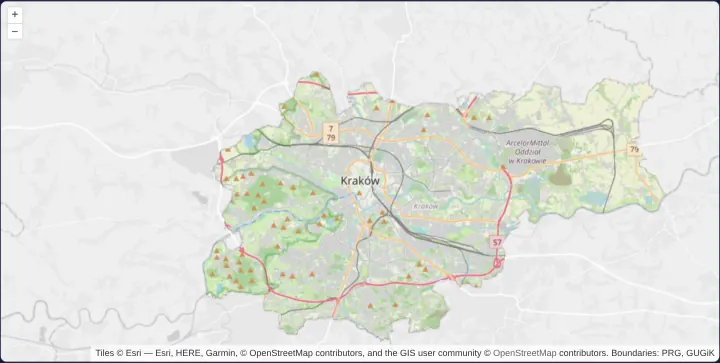
Clip a layer to a polygon
Clip an OpenLayers tile layer to Kraków’s exact GeoJSON municipal polygon using destination-in canvas compositing and getVectorContext.
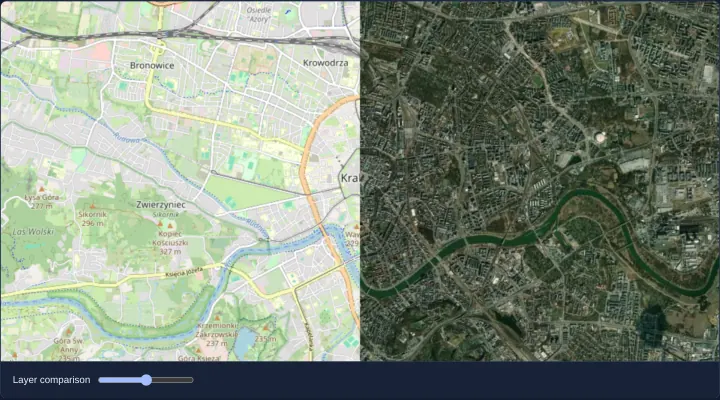
Compare layers with a swipe
Build an interactive before-and-after OpenLayers layer swipe comparison between OpenStreetMap and Esri satellite imagery using prerender clipping.
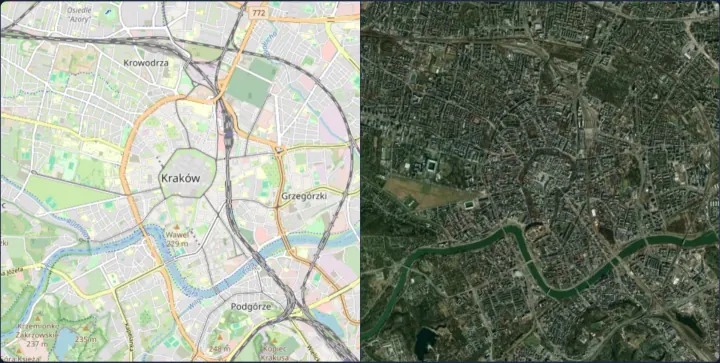
Two maps with one view
Synchronize two side-by-side OpenLayers maps over Kraków—OpenStreetMap and satellite imagery—by sharing a single View instance via setView.
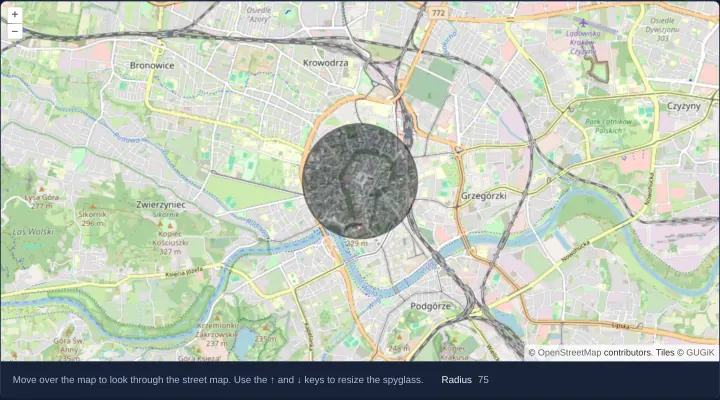
A spyglass from one layer into another
Create an interactive OpenLayers spyglass lens revealing aerial orthophotography inside a cursor-following circular aperture over OpenStreetMap.
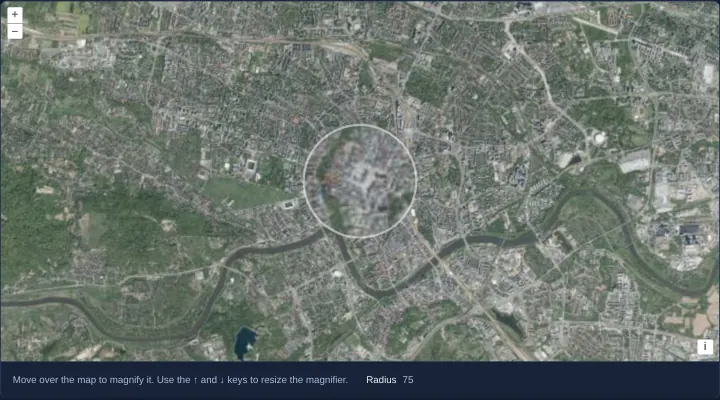
A magnifier over imagery
Build a 2x pixel magnifier loupe over OpenLayers aerial imagery by resampling canvas pixels with getImageData and putImageData in postrender.
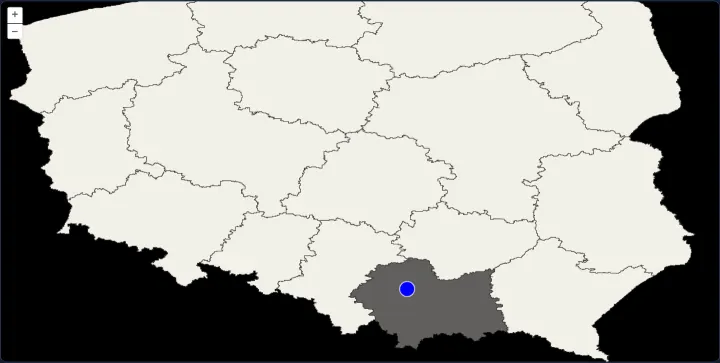
An SVG map as a layer
Mount an interactive SVG map of Poland’s voivodeships as a custom OpenLayers render layer aligned via composeCssTransform and styled with CSS.
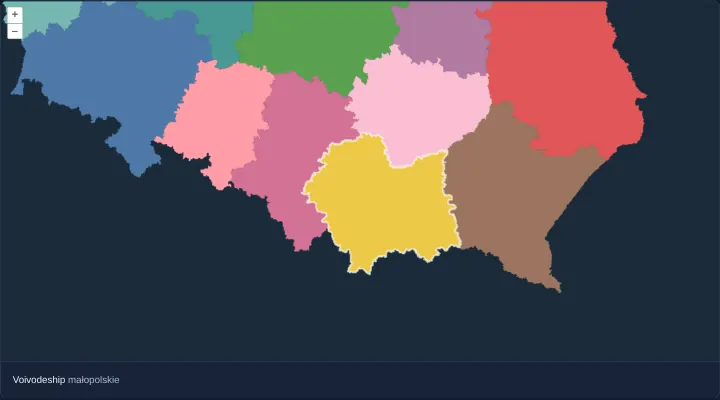
Render vector data as an image
Accelerate dense polygon panning in OpenLayers with VectorImageLayer, a 2x imageRatio buffer and hit-detected hover highlights in Angular.
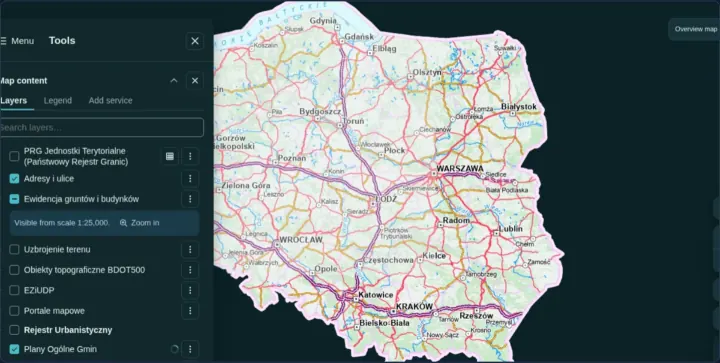
Pan and zoom a static image
Display non-geographic floor plans, diagrams or screenshots in OpenLayers using a custom pixel-based Projection and an ImageStatic source.
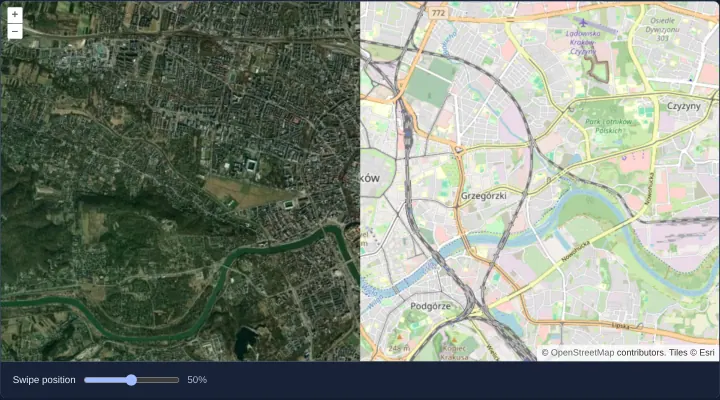
Swipe between WebGL map layers
Compare two GPU WebGLTileLayers—OpenStreetMap and Esri World Imagery—in OpenLayers using a swipe slider and WebGL gl.scissor() clipping.
Tile and image services
31 examplesXYZ, WMS, WMTS, ArcGIS, OGC API and MapServer services: tiles, single images, capabilities, legends and feature info.
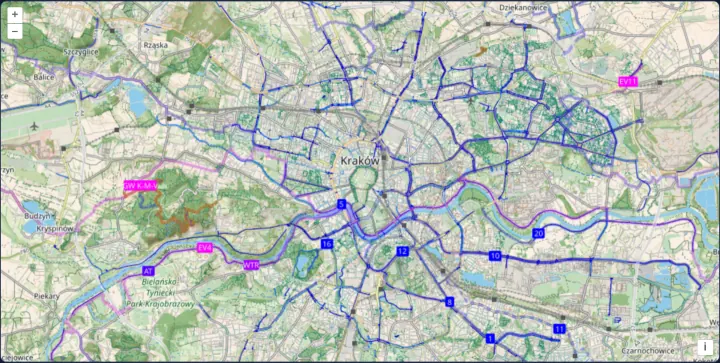
XYZ tiles from a URL template
Load CyclOSM bicycle map tiles in OpenLayers from a multi-subdomain {a-c} XYZ URL template with CORS image tile fetching and attributions.
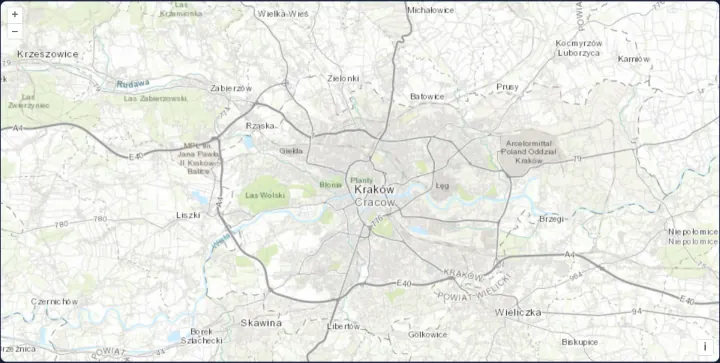
Esri's topographic map as XYZ tiles
Render Esri World Topographic Map cached raster tiles on the GPU in OpenLayers using ArcGIS {z}/{y}/{x} URL ordering and a WebGLTileLayer.
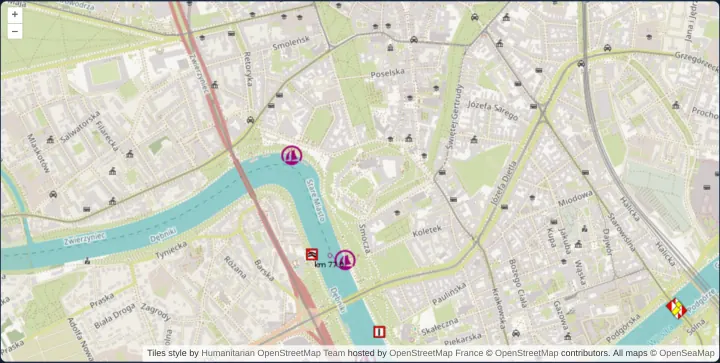
OpenStreetMap from another tile server
Point OpenLayers’ OSM source at custom regional tile servers and stack transparent OpenSeaMap river navigation marks over Kraków’s Vistula.
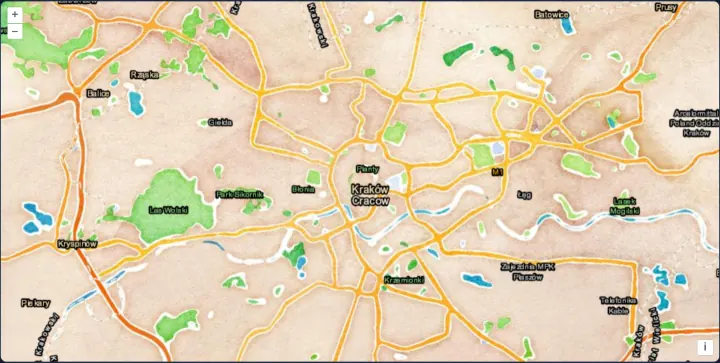
A watercolour map with labels over it
Stack transparent Esri reference labels and borders above archival Stamen Watercolor tiles in OpenLayers while capping source maxZoom at 18.
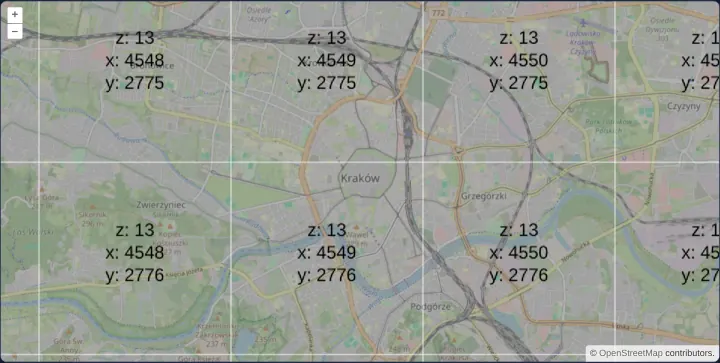
Tiles made in the browser from pixel data
Generate procedural RGBA pixel-array tiles in the browser with OpenLayers DataTileSource and render them on the GPU via WebGLTileLayer.
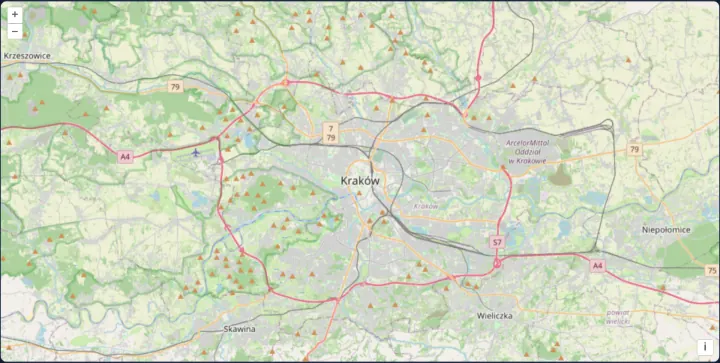
Tiles described by TileJSON
Configure an OpenLayers XYZ raster layer dynamically at runtime from a TileJSON metadata document supplying URLs, zoom bounds and credits.
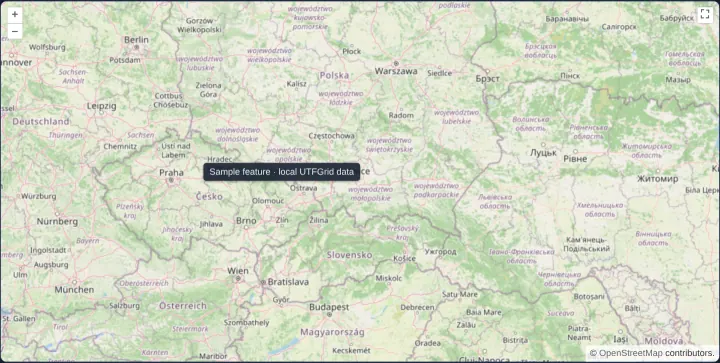
Data under the pointer with UTFGrid
Inspect raster UTFGrid tile attributes on hover in OpenLayers and display labels in an HTML overlay while discarding stale pointer responses.
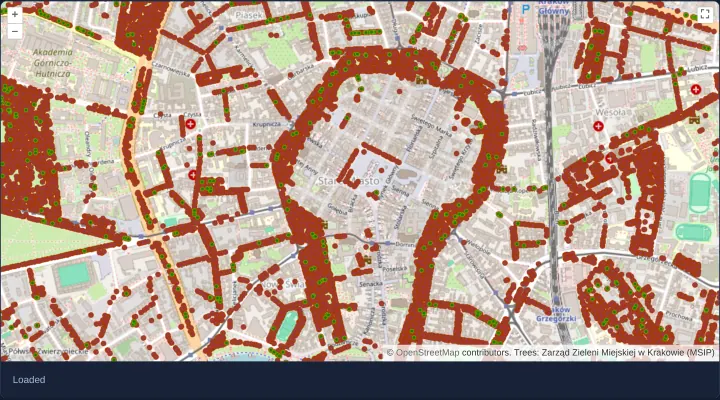
An ArcGIS MapServer layer
Export Kraków municipal trees from an ArcGIS MapServer REST service as a single dynamic viewport image over OpenStreetMap with load status.
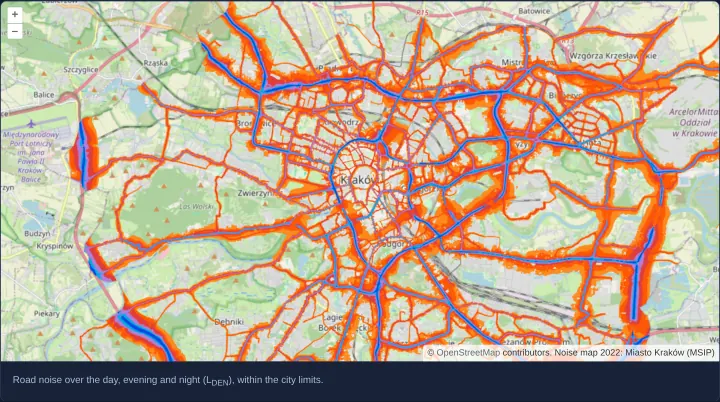
An ArcGIS map service as tiles
Request Kraków’s 2022 road noise map tile by tile from a dynamic ArcGIS MapServer REST service within city bounds at native HiDPI density.
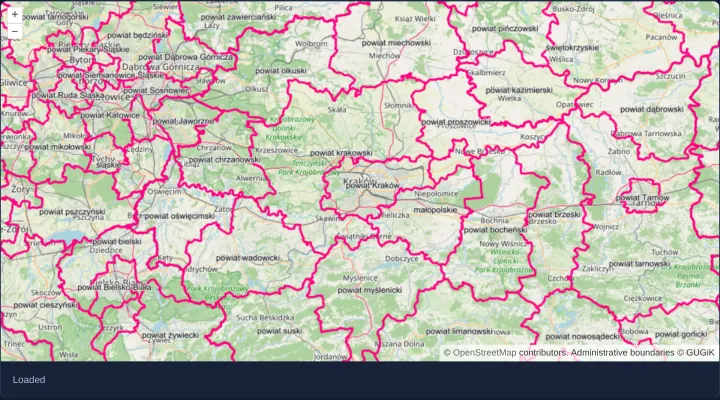
A WMS layer as one image
Render GUGiK administrative boundaries around Kraków as a single viewport-sized WMS GetMap image in OpenLayers with live image load events.
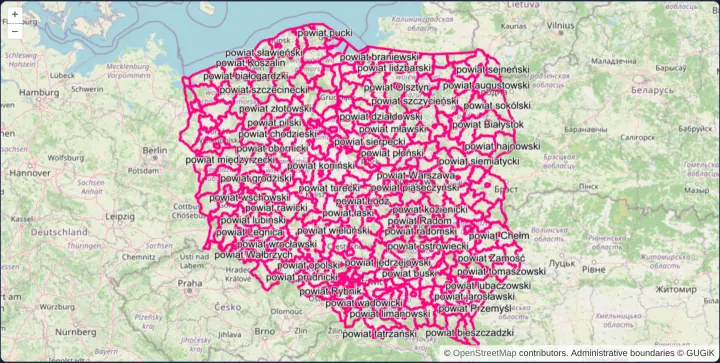
A WMS image within an extent
Fence a national GUGiK county-boundary WMS image layer inside Poland’s Web Mercator extent and render crisp HiDPI output via MapServer DPI.
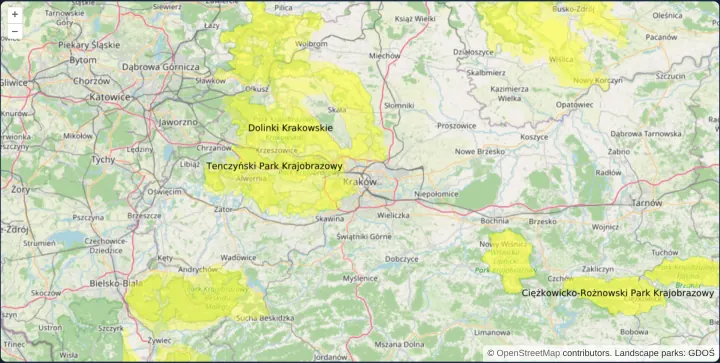
A WMS image in SVG
Load GDOŚ landscape parks around Kraków from a GeoServer WMS in vector image/svg+xml format so boundaries stay crisp while zooming the map.
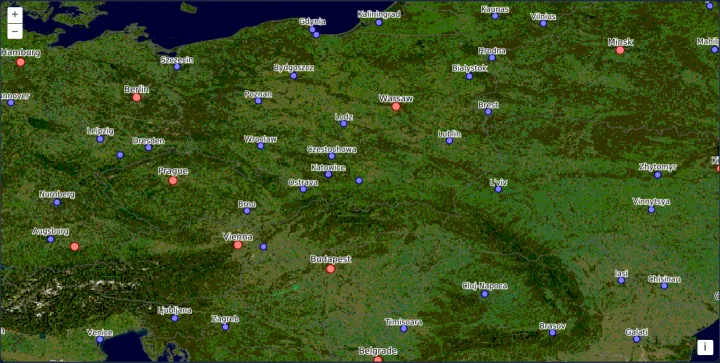
MapServer WMS images in degrees
Query a MapServer WMS 1.3.0 directly in geographic EPSG:4326 degrees with latitude-first axis order and HiDPI MAP_RESOLUTION in Angular.
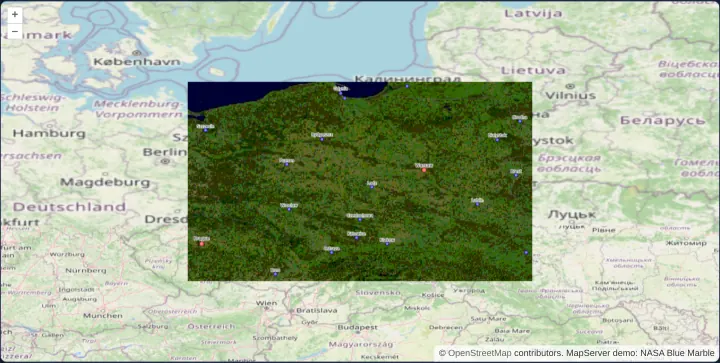
MapServer's own CGI interface
Render legacy native MapServer mode=map CGI layers in geographic EPSG:4326 degrees over reprojected OpenStreetMap tiles within Poland bounds.
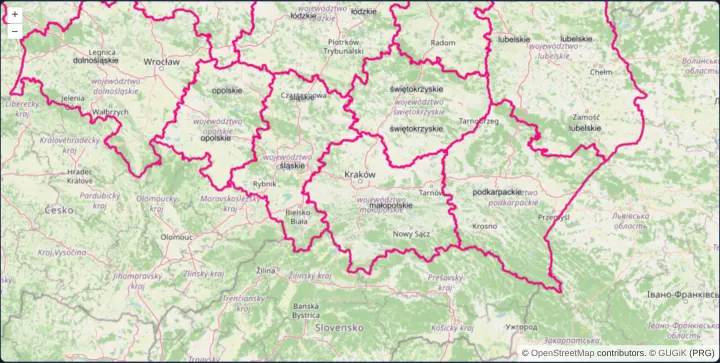
A WMS layer as tiles
Stream Polish voivodeship boundaries from GUGiK as 256-pixel WMS tiles over OpenStreetMap using CORS-enabled WebGL tile layers in Angular.
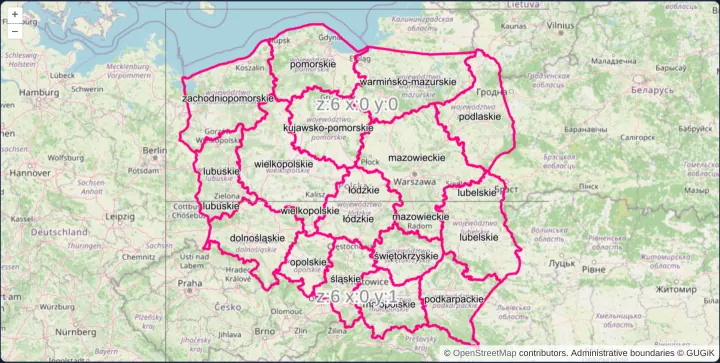
WMS tiles of 512 by 256 pixels
Configure a custom 512x256 rectangular OpenLayers TileGrid bounded to Poland for tiled WMS requests and inspect seams with a TileDebug layer.
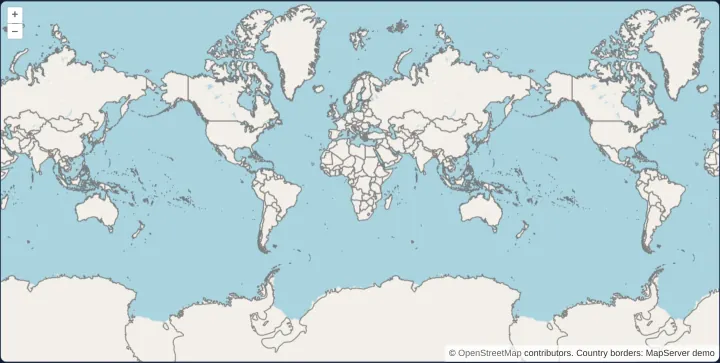
WMS tiles across the 180th meridian
Wrap tiled WMS country borders seamlessly east and west across the 180th antimeridian on a multiWorld OpenLayers map at global zoom scales.
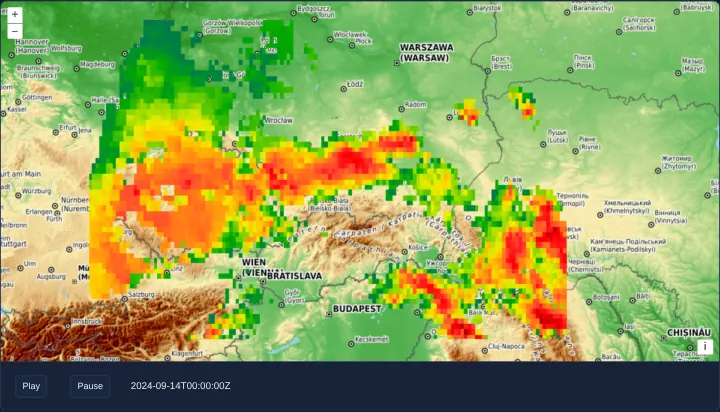
Animate a WMS by its time dimension
Animate half-hourly NASA GPM IMERG Storm Boris precipitation over southern Poland in OpenLayers by stepping the WMS TIME dimension parameter.
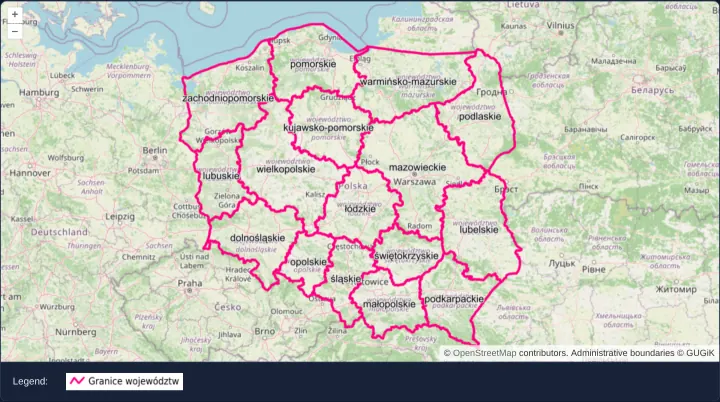
A WMS layer's legend for the view's scale
Fetch a scale-aware WMS GetLegendGraphic image in OpenLayers with getLegendUrl and refresh it automatically whenever view resolution changes.
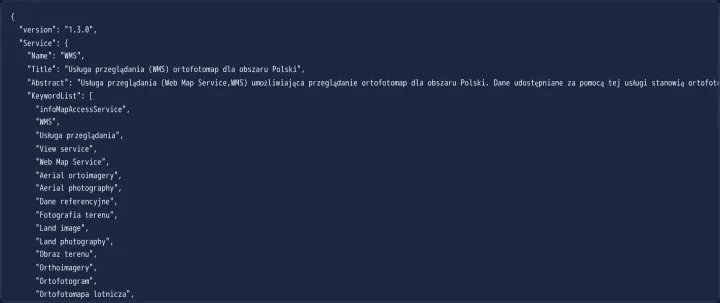
Read a WMS service's capabilities
Parse an OGC WMS GetCapabilities XML document into structured JavaScript JSON in OpenLayers using the built-in WMSCapabilities format parser.
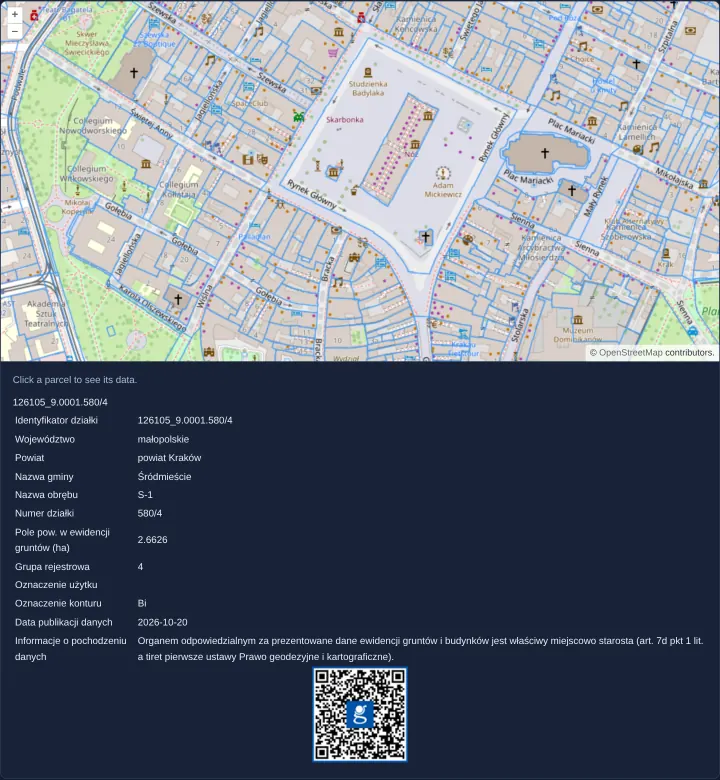
A parcel's data from a WMS image
Query cadastral parcel attributes on click from GUGiK’s national land-registry WMS in OpenLayers using getFeatureInfoUrl and pixel hit tests.
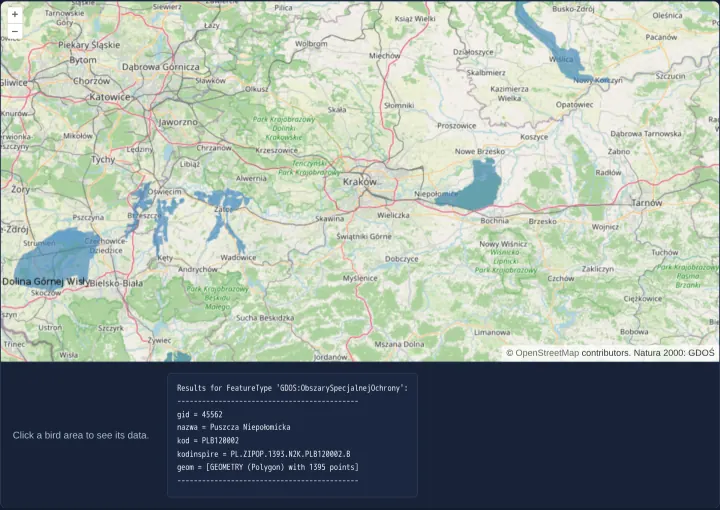
A protected area's data from WMS tiles
Query Natura 2000 protected bird areas on click from a tiled GeoServer WMS in OpenLayers using TileWMS getFeatureInfoUrl and text/plain.
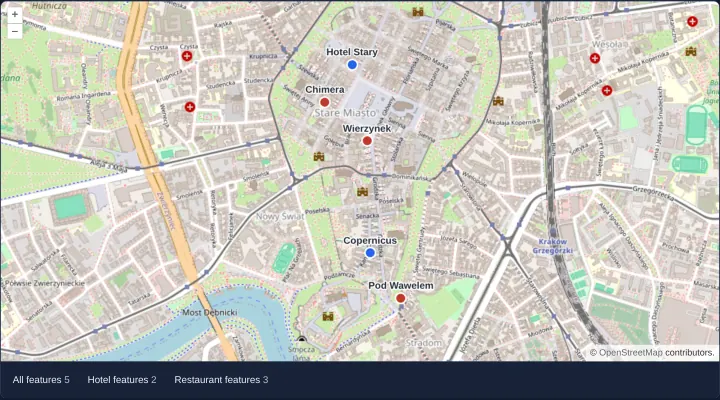
Features of one WMS answer split by layer
Parse multi-layer GML WMS GetFeatureInfo responses in OpenLayers with WMSGetFeatureInfo and split features by layer name into vector layers.
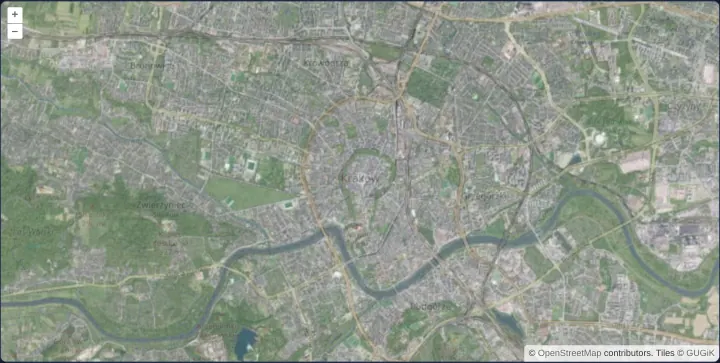
A WMTS layer configured by hand
Configure an OpenLayers WMTS orthophotomap layer manually with an explicit WMTSTileGrid, string matrixIds, resolutions and 70% opacity.
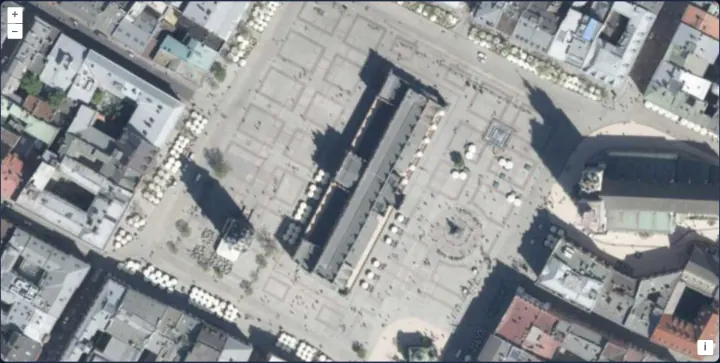
An orthophoto WMTS at zoom 18
Display sub-metre WMTS aerial orthophotography at zoom 18 in OpenLayers with exact Web Mercator origin alignment on Kraków’s Main Square.
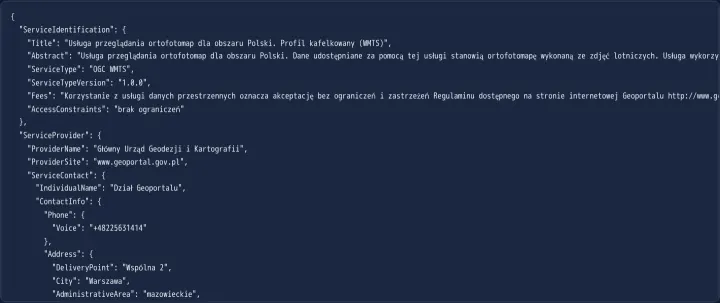
Read a WMTS service's capabilities
Parse OGC WMTS GetCapabilities XML in OpenLayers with WMTSCapabilities to inspect available layers, formats, KVP GetTile endpoints and tile matrix sets.
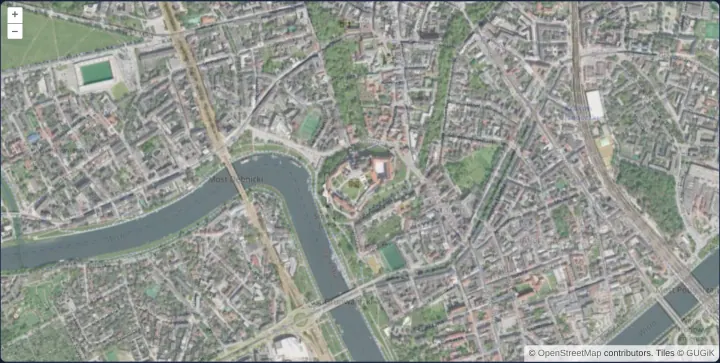
A WMTS layer from its capabilities
Create an OpenLayers WMTS layer automatically from parsed GetCapabilities XML using optionsFromCapabilities over OpenStreetMap in Kraków.
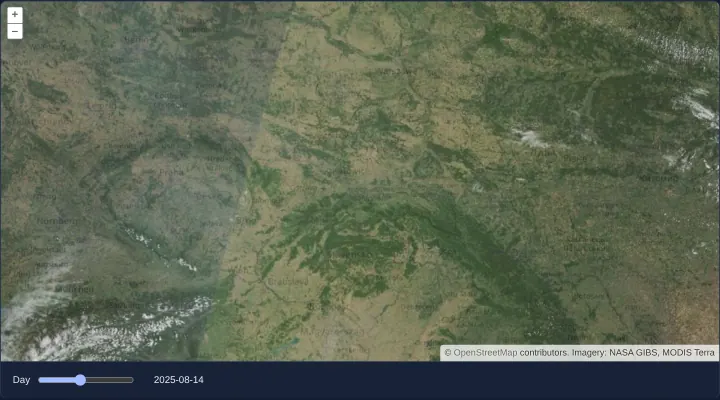
A WMTS layer's time dimension
Browse daily NASA MODIS Terra satellite imagery over Poland in OpenLayers by binding a date slider to a REST WMTS Time dimension parameter.
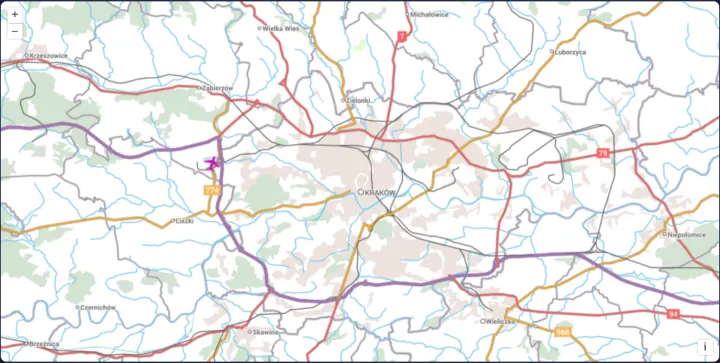
Map tiles from OGC API - Tiles
Load EuroGeographics raster tiles from an OGC API - Tiles JSON service in OpenLayers with aol-source-ogcmaptile and explicit CRS projection.
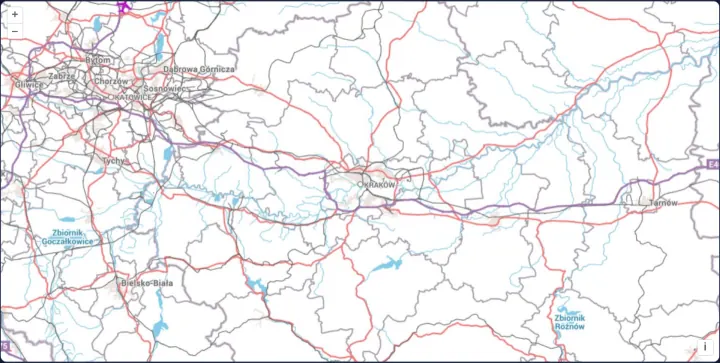
One map image from OGC API - Maps
Render single-image regional maps from an OGC API - Maps /map endpoint in OpenLayers with HiDPI mm-per-pixel scaling and generous pan overscan.
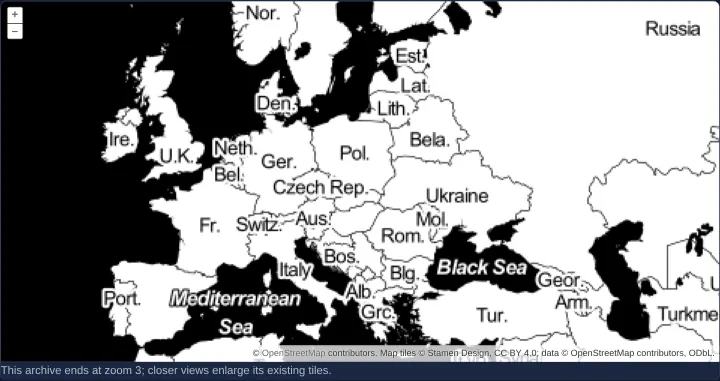
Read raster tiles from PMTiles
Stream Stamen raster tiles directly from a serverless single-file PMTiles archive in OpenLayers using HTTP byte-range requests and object URLs.
Vector data
41 examplesGeoJSON, KML, GPX, IGC, TopoJSON, WKT and WKB, WFS and OSM XML, vector tiles, dropped files, clusters and generated geometries.
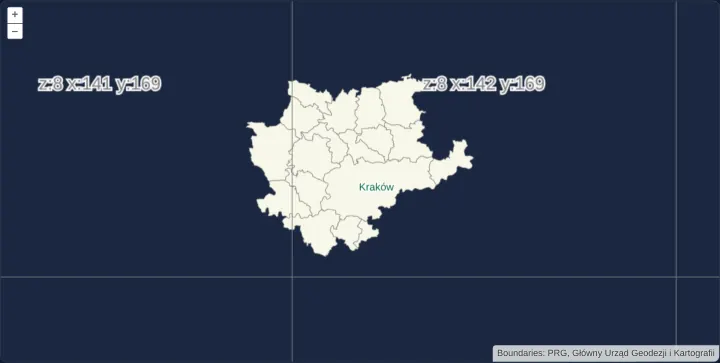
Canvas vector tiles in TMS order
Render local MVT municipality vector tiles in south-origin TMS row order and inspect z/x/-y tile grid coordinates in Angular and React.
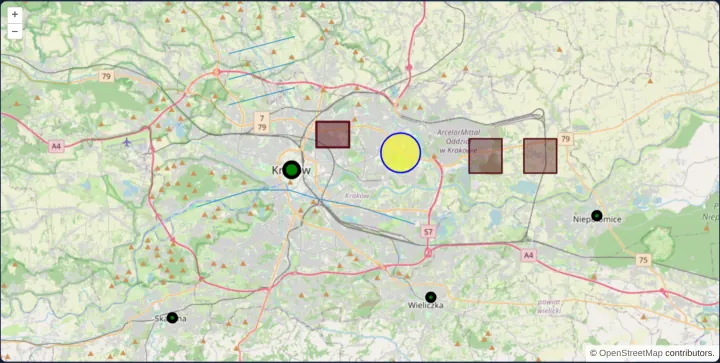
Points, lines, polygons and circles
Declare Point, MultiPoint, LineString, MultiLineString, Polygon, MultiPolygon and Circle geometries declaratively in an OpenLayers template.
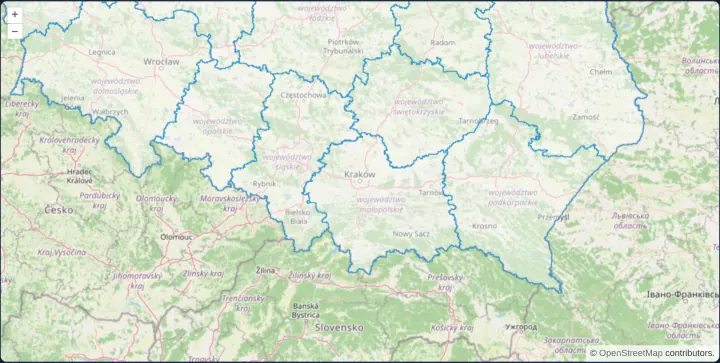
Load GeoJSON from a URL
Fetch and render Polish voivodeship polygons from a bundled GeoJSON URL in OpenLayers with automatic CRS transformation into Web Mercator.
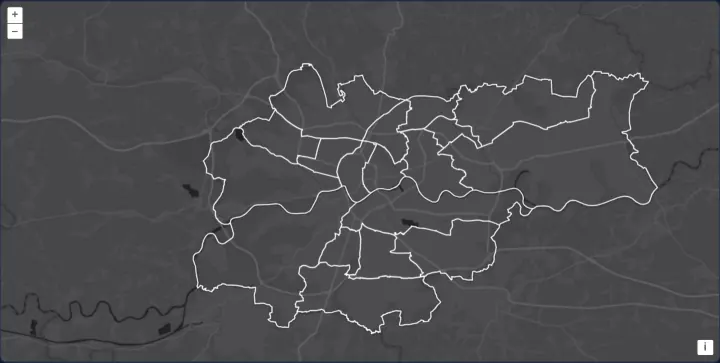
Kraków districts from TopoJSON
Render Kraków’s 18 administrative districts from a compact shared-arc TopoJSON topology over Esri Dark Gray using non-overlapping flat styles.
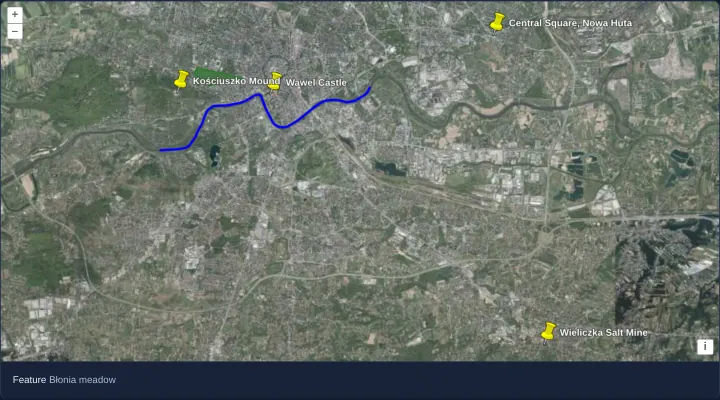
Places and their styles from KML
Display KML placemarks, polygons and lines with embedded styles in OpenLayers over Kraków’s orthophotomap and inspect overlapping features.
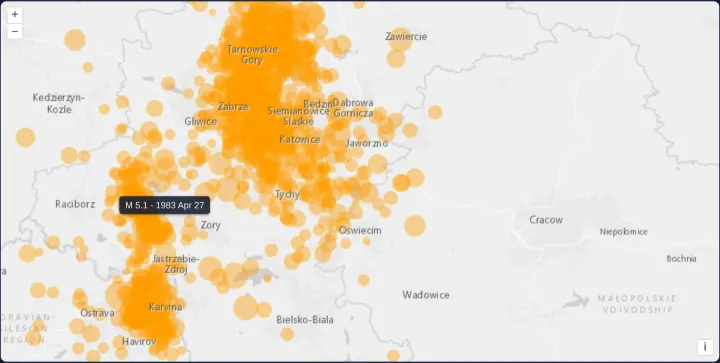
Seismic events from KML
Render 1,130 KML seismic events in OpenLayers as magnitude-scaled circles using extractStyles: false, a radius styleCache and hover tooltips.
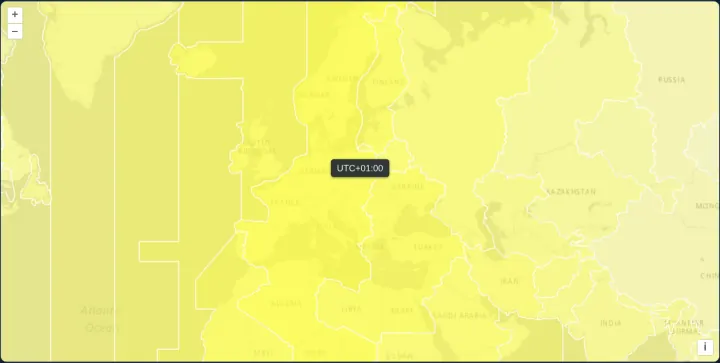
The world's time zones from KML
Style world time-zone polygons from KML in OpenLayers by proximity to local solar noon using silent feature property updates and hover labels.
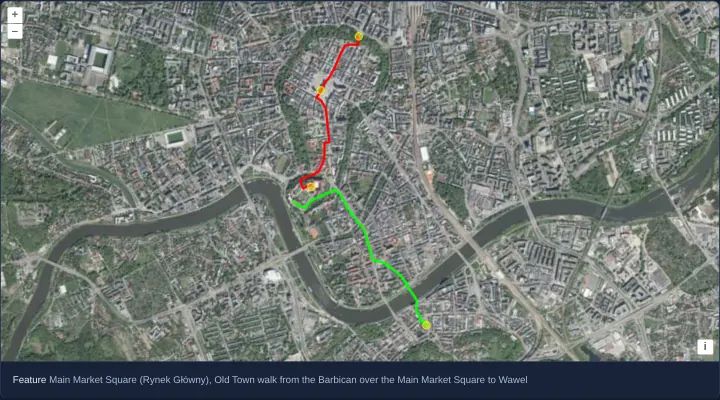
Waypoints, a route and a track from GPX
Load GPS waypoints, planned routes and recorded tracks from a GPX file in OpenLayers, styling each geometry type over aerial orthophotography.
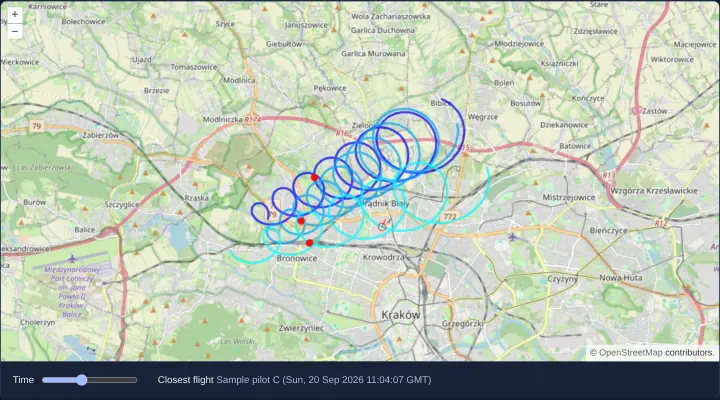
Flight tracks from IGC
Replay multi-pilot IGC flight logs in OpenLayers using M-coordinate timestamps, getCoordinateAtM time scrubbing and nearest-track snapping.
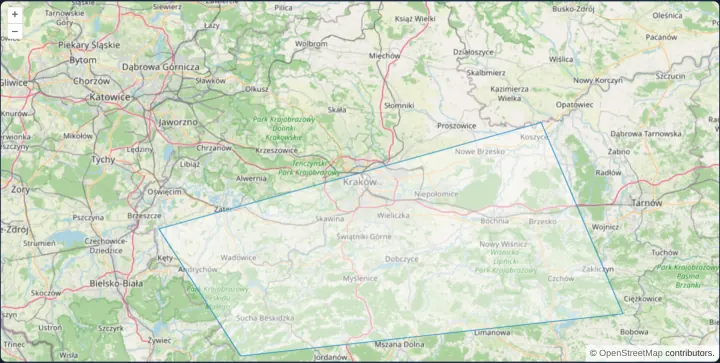
A polygon from WKT
Parse a geographic Well-Known Text (WKT) polygon in OpenLayers with readGeometry and reproject its degrees from EPSG:4326 into Web Mercator.
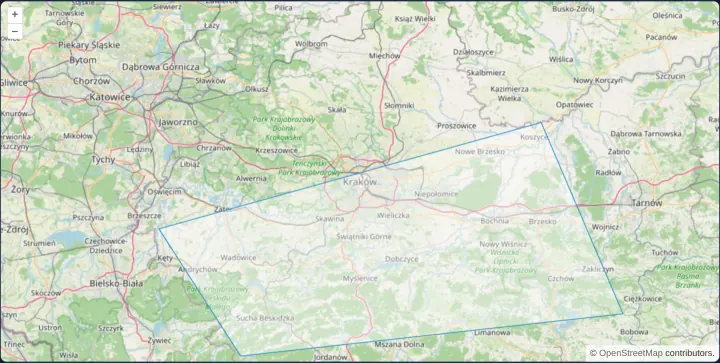
A polygon from WKB
Decode hexadecimal Well-Known Binary (WKB) geometries from spatial databases in OpenLayers using readGeometry and explicit projection options.
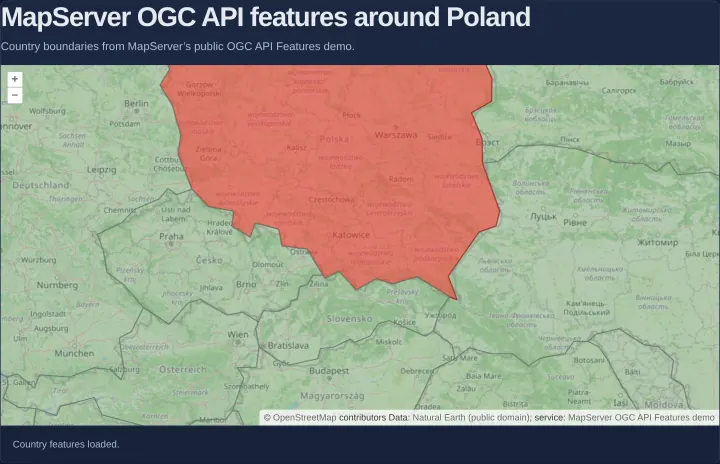
Country polygons from MapServer OGC API Features
Load GeoJSON country polygons dynamically by viewport extent from an OGC API Features collection in OpenLayers with pagination and cleanup.
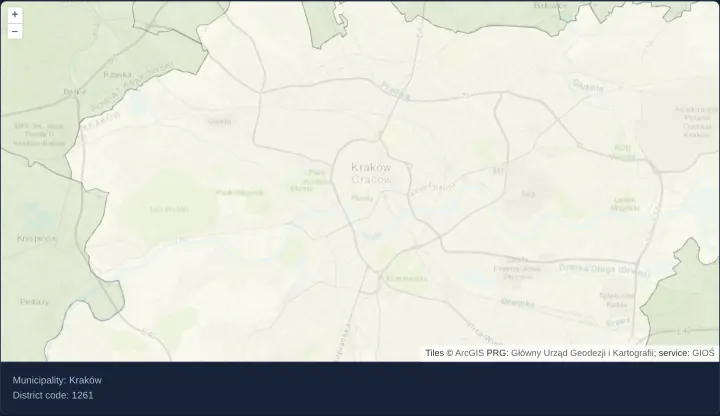
ArcGIS REST features loaded by tile extent
Query PRG Polish municipality polygons by 512px tile envelopes from an ArcGIS REST Feature/MapServer in OpenLayers and decode EsriJSON.
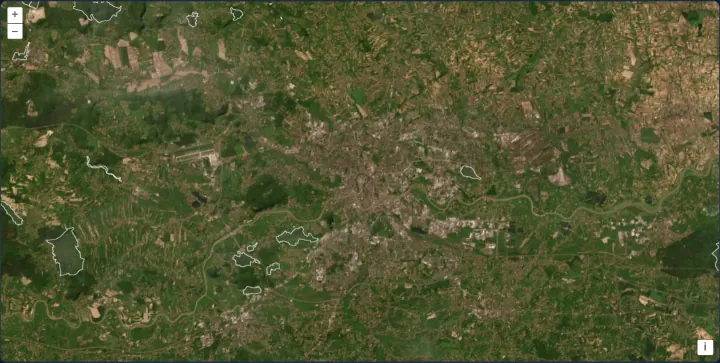
Natura 2000 areas from WFS by extent
Load Natura 2000 habitat polygons around Kraków by viewport extent from GDOŚ’s WFS in OpenLayers using a bbox strategy and stable site codes.
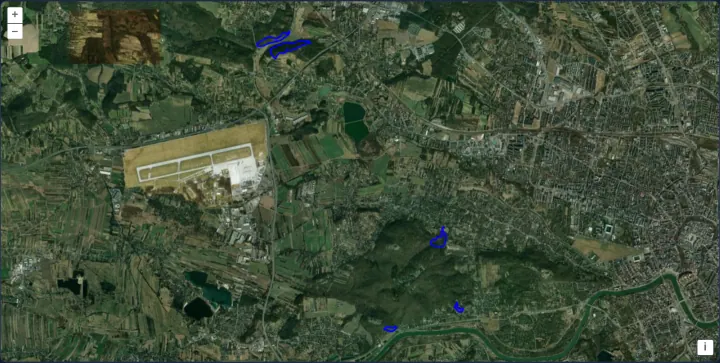
A filtered WFS GetFeature request
Post a filtered XML WFS GetFeature query with spatial and case-insensitive name filters in OpenLayers and fit the view to matching reserves.
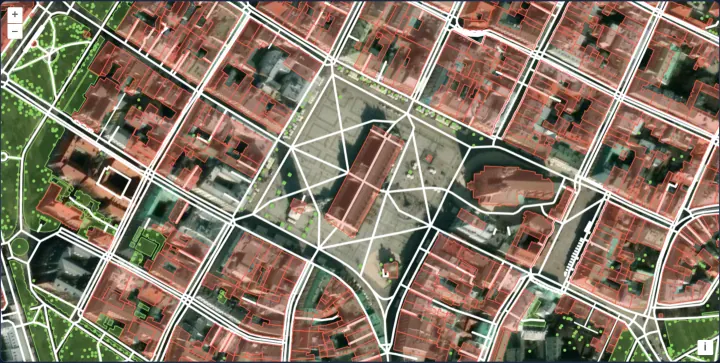
OpenStreetMap data from the Overpass API
Query live OpenStreetMap buildings, streets, car parks and parks from the Overpass API by map extent in OpenLayers and style features by tag.
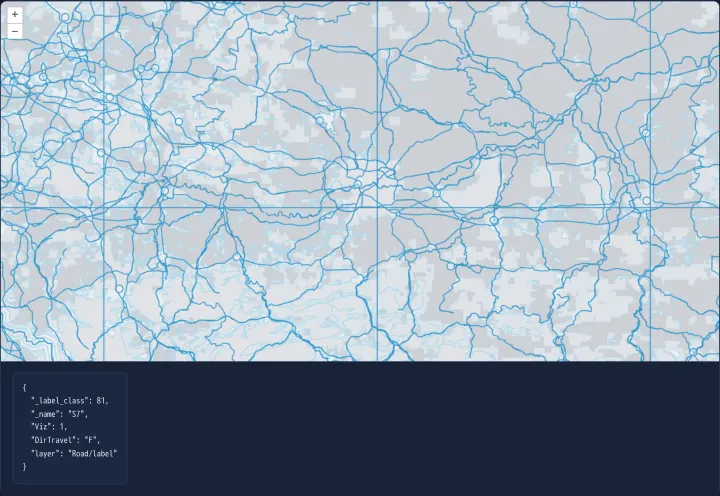
Feature properties from vector tiles
Inspect vector-tile RenderFeature attributes under the pointer as formatted JSON in OpenLayers over Esri World Basemap Mapbox Vector Tiles.
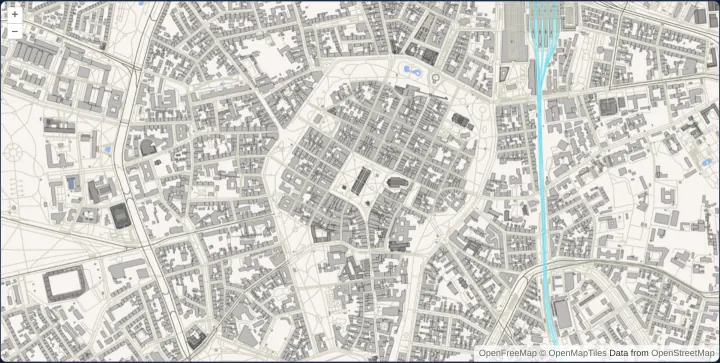
Layered OpenStreetMap vector tiles
Decode local OpenMapTiles TopoJSON vector tiles around Kraków in OpenLayers and style water, roads, railways and buildings by resolution.
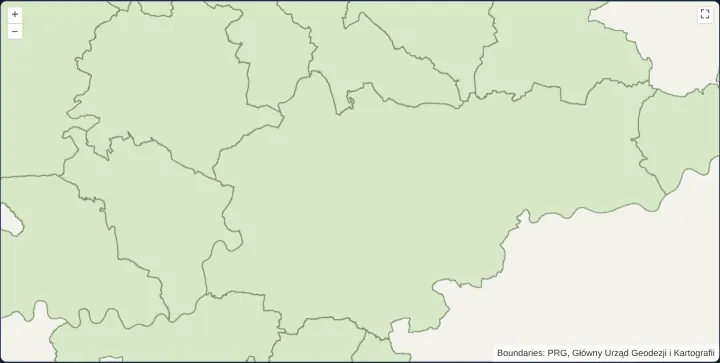
Create a map from a local Mapbox style
Apply a complete Mapbox GL v8 style document to an OpenLayers map using ol-mapbox-style and local TMS municipality vector tiles around Kraków.
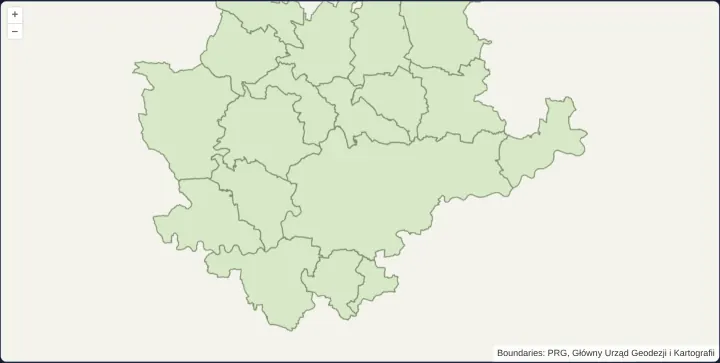
Use a MapboxVectorLayer with a local style
Mount a standalone MapboxVectorLayer from a local Mapbox GL v8 style URL in OpenLayers to render municipality vector tiles alongside layers.
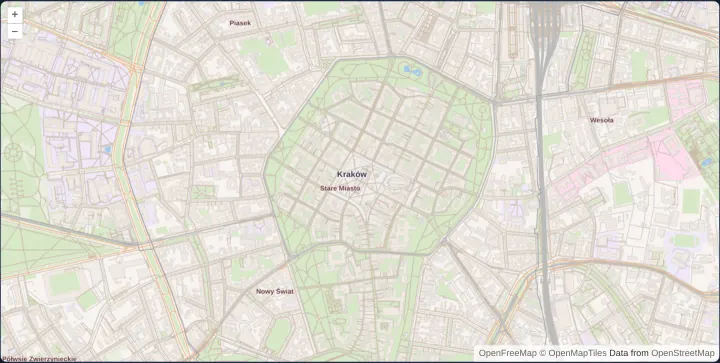
Classified Mapbox-format vector tiles
Style multi-layer Mapbox-format OpenMapTiles vector tiles around Kraków in OpenLayers with flat rules and decluttered neighbourhood labels.
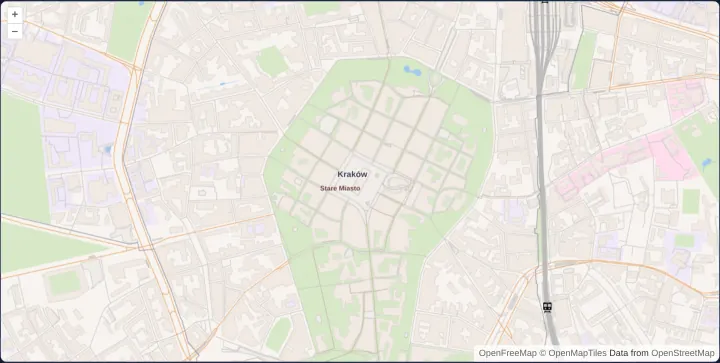
Reuse alternate native vector-tile levels
Reuse odd native Mapbox Vector Tile zoom levels across intermediate OpenLayers view zooms with a custom 512px tile matrix and shared styles.
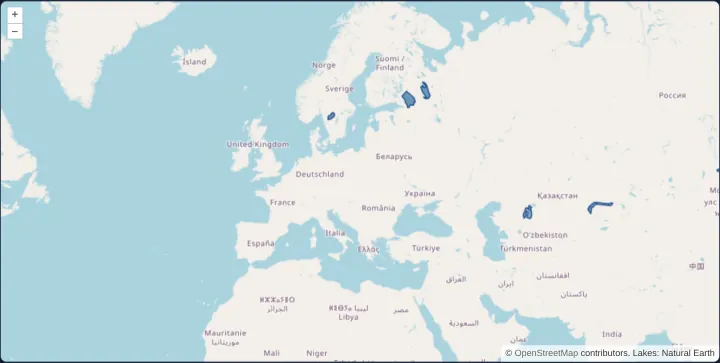
Vector tiles from OGC API - Tiles
Render Natural Earth lake polygons as Mapbox Vector Tiles from an OGC API - Tiles WebMercatorQuad service in OpenLayers using flat styles.
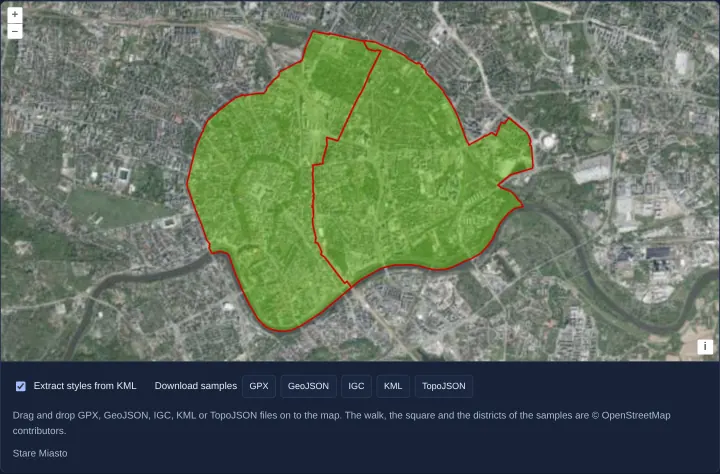
Drop GPX, GeoJSON, IGC, KML and TopoJSON files
Drop local GPX, GeoJSON, IGC, KML or TopoJSON files directly onto an OpenLayers map to create styled vector layers client-side in the browser.
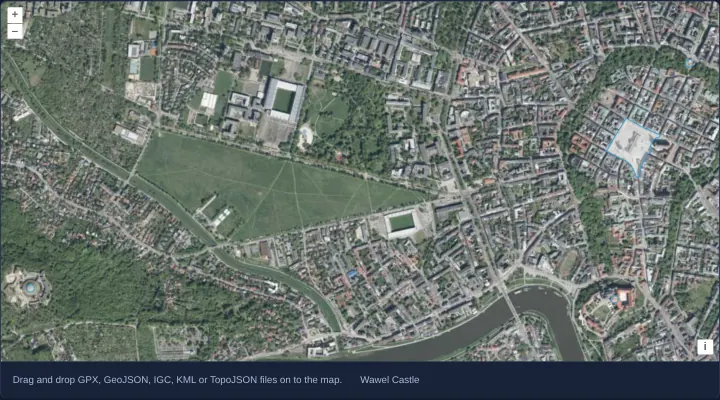
Drop files onto vector image layers
Drop large GPX, GeoJSON, IGC, KML or TopoJSON files onto an OpenLayers map and render each dataset smoothly through a fast VectorImageLayer.
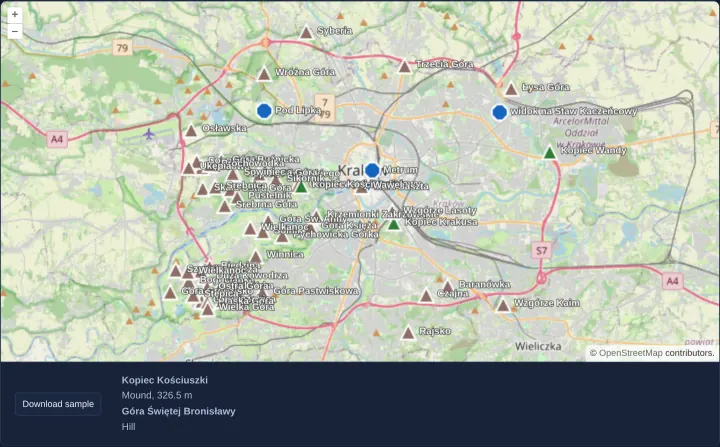
Drop KMZ archives with their icons
Unpack dropped KMZ archives in the browser with a custom OpenLayers KML format that resolves bundled ZIP icons and sanitizes HTML descriptions.
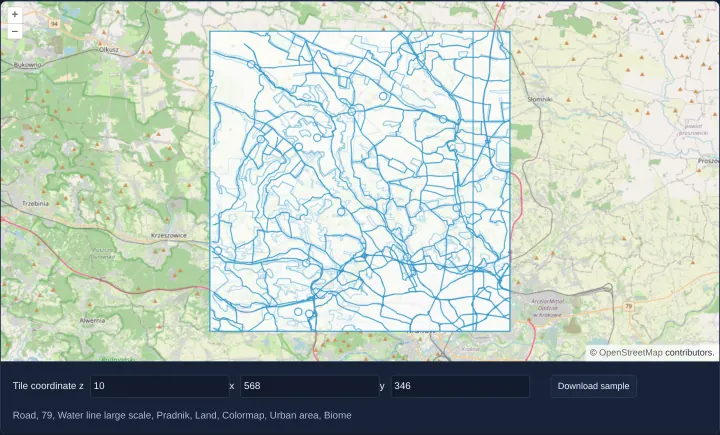
Preview a dropped vector tile
Drop raw Mapbox Vector Tile files onto an OpenLayers map and georeference them at z, x and y tile coordinates using a custom MVT format class.
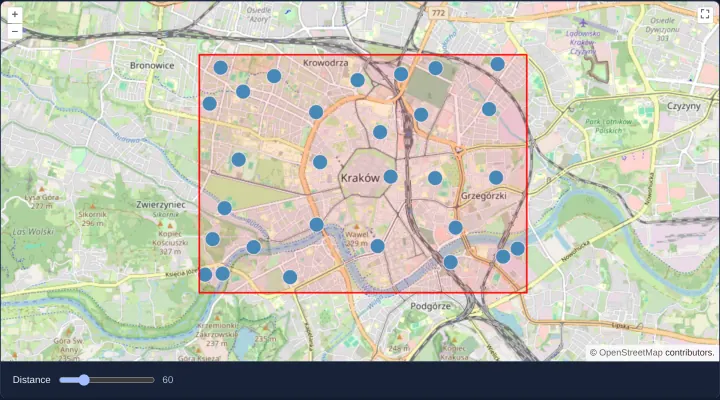
Cluster points by distance
Group 2,000 dense points dynamically in OpenLayers with aol-source-cluster and adjust the pixel clustering distance live with a reactive slider.
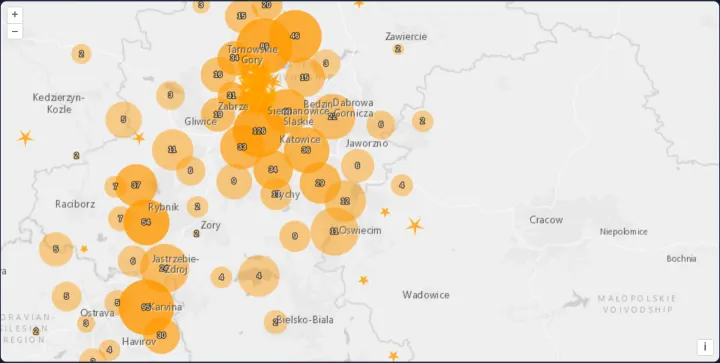
Clusters drawn at the size of their extent
Cluster 1,130 KML seismic events in OpenLayers as extent-sized circles that expand on hover or click into magnitude-scaled five-pointed stars.
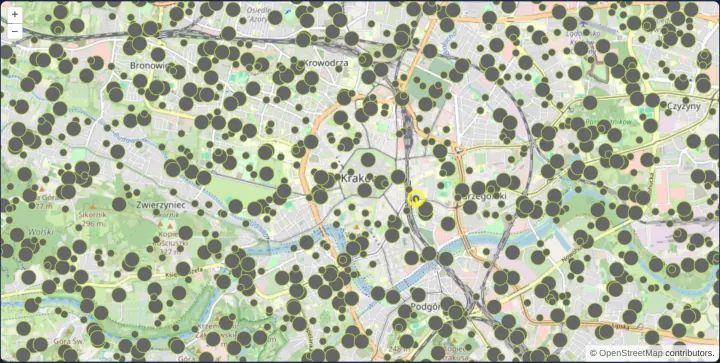
Twenty thousand points with snapping
Render 20,000 seeded vector points smoothly in OpenLayers using two shared styles and snap a postrender indicator line to the nearest feature.
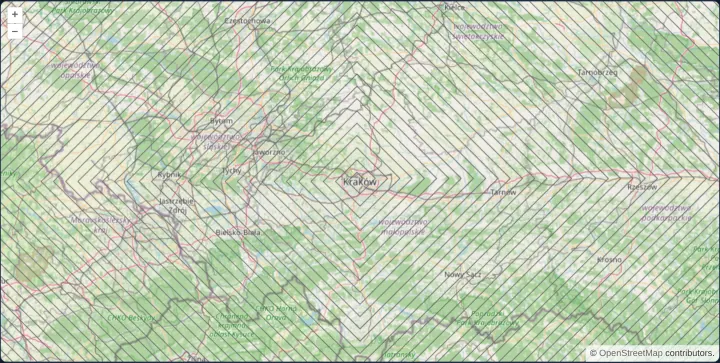
A spiral of ten thousand lines
Benchmark OpenLayers vector rendering on a 10,000-segment square spiral around Kraków indexed in one pass via addFeatures with wrapX disabled.
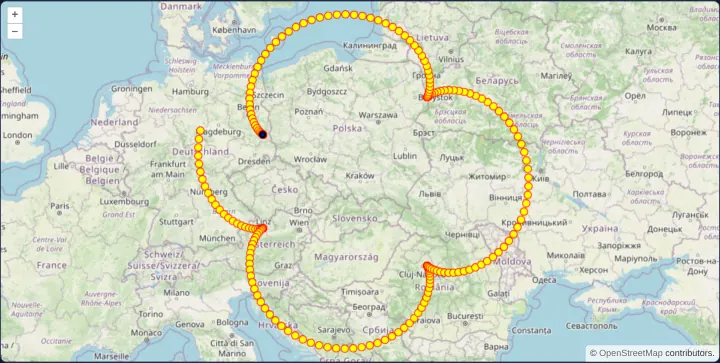
Points drawn in every frame
Animate 200 moving points at 60 fps directly on an OpenLayers tile-layer canvas in postrender using getVectorContext and frameState timestamps.
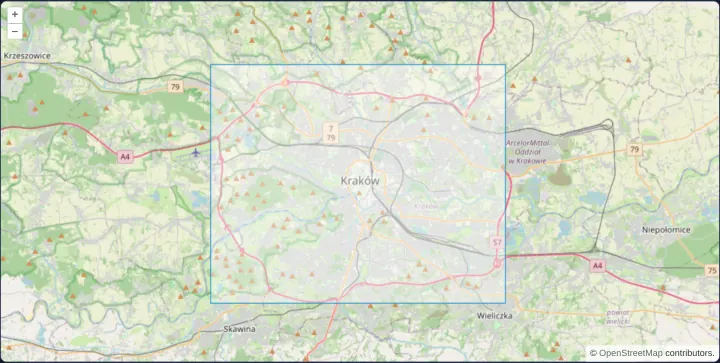
A rectangle from a bounding box
Draw a closed geographic bounding-box polygon over Kraków in an OpenLayers template using aol-geometry-polygon and EPSG:4326 corner coordinates.
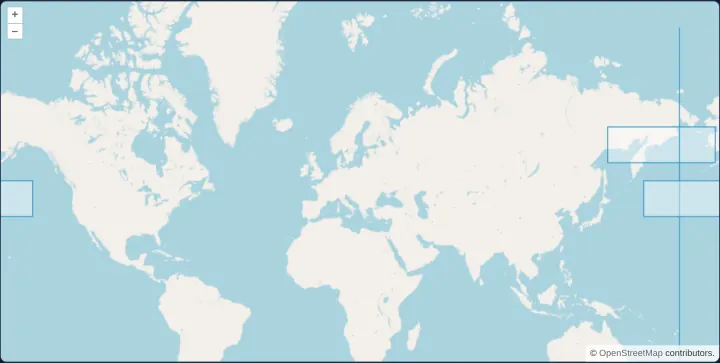
Polygons across the antimeridian
Render continuous trans-Pacific polygons across the 180th antimeridian in OpenLayers using extended Web Mercator coordinates and world wrapping.
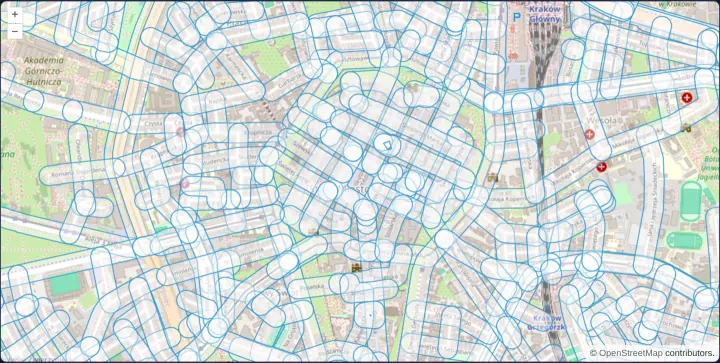
Buffer streets with JSTS
Compute true 40-metre ground buffers around 456 Kraków Old Town streets in the browser using JSTS and OpenLayers latitude-adjusted projection.
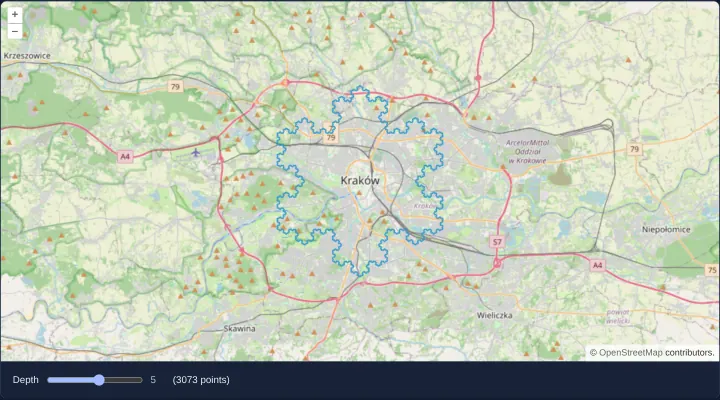
A Koch snowflake of up to 786,433 points
Render a recursive Koch snowflake up to 786,433 vertices over Kraków in OpenLayers to demonstrate automatic Douglas-Peucker simplification.
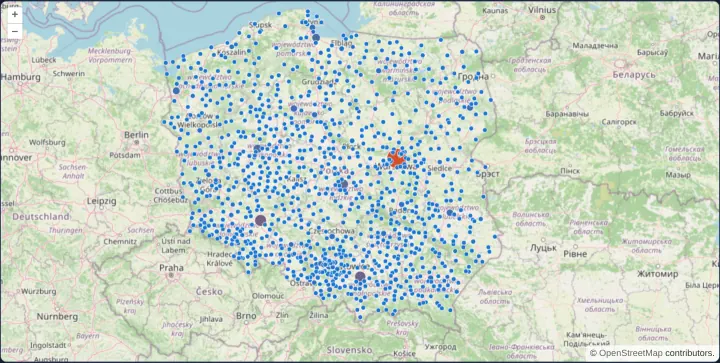
Population symbols for Polish towns
Style Polish towns by population using shared OpenLayers flat expressions and inspect town names and counts in a point-anchored HTML overlay.
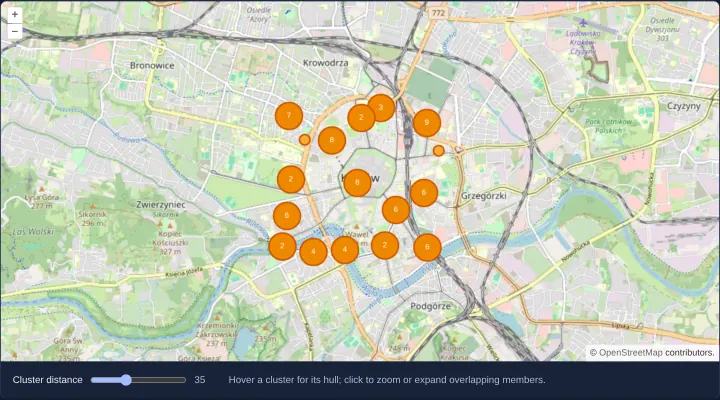
Cluster hulls and expanded members
Inspect dynamic OpenLayers point clusters through hover convex-hull polygons, click-to-zoom bounds and fanned-out overlapping member markers.
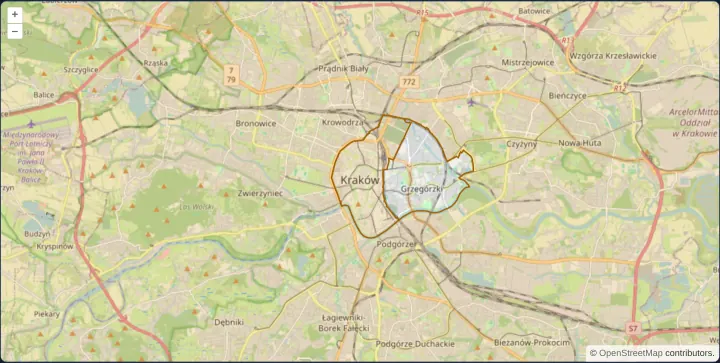
Draw district boundaries with D3
Render TopoJSON district boundaries as a custom D3-projected SVG layer synchronized with OpenLayers pan, zoom and rotation in Angular and React.
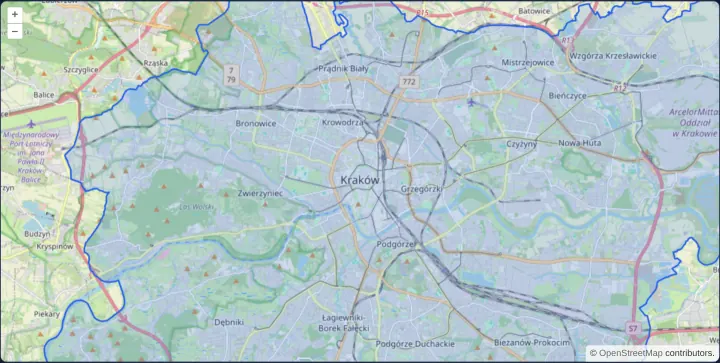
Tile GeoJSON in the browser
Slice a local GeoJSON dataset into dynamic vector tiles inside the browser using geojson-vt and render them via an OpenLayers VectorTileSource.
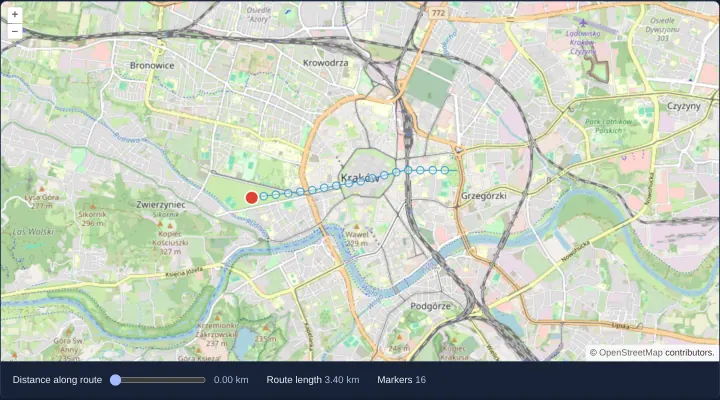
Place markers along a route
Measure geographic route length and place distance-interval markers along polylines in OpenLayers using @turf/length and @turf/along helpers.
Styling and labels
24 examplesStrokes, fills, icons, regular shapes, gradients and patterns, labels and their decluttering, style expressions and custom renderers.
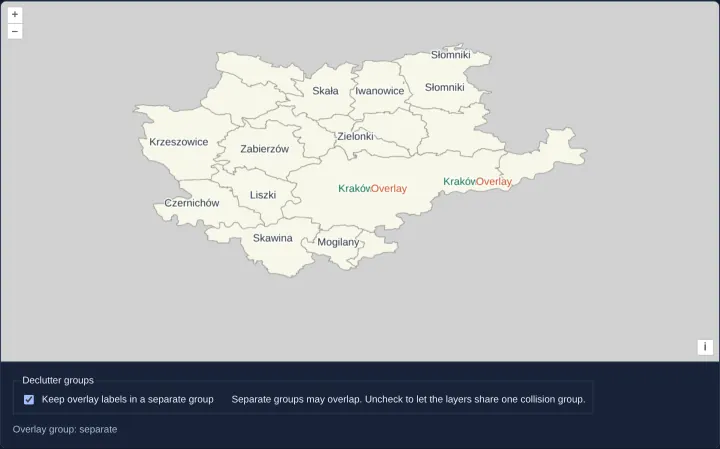
Separate label collision groups
Control cross-layer label collisions in OpenLayers vector tiles by assigning independent or shared declutter group identifiers in Angular and React.
Hover and selection styles
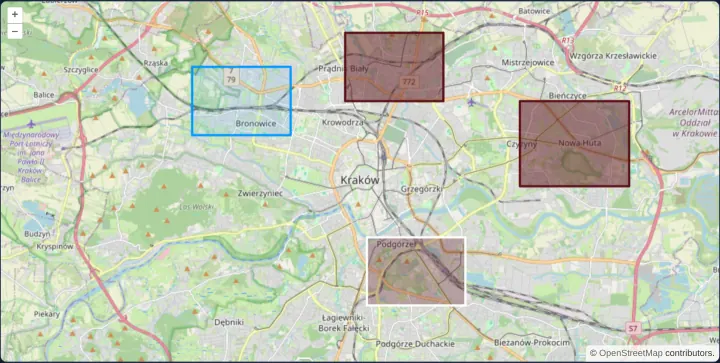
Combine reactive pointer-hover feature styles and click selection styles on OpenLayers vector polygons in Angular and React without conflicts.
An SVG marker on a coordinate
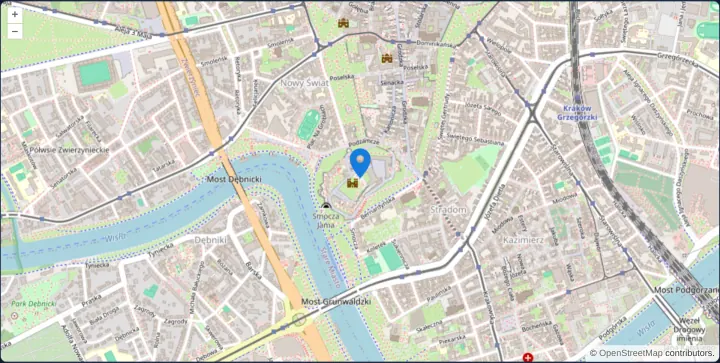
Anchor a crisp scaled SVG map pin by its bottom edge on a WGS84 coordinate in OpenLayers using aol-style-icon and a fractional icon anchor.
Several styles for one feature
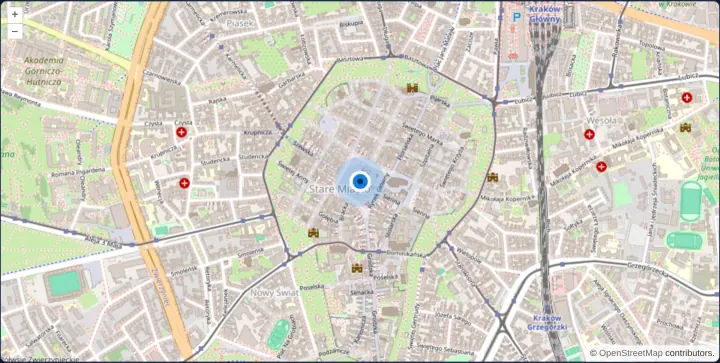
Compose three concentric OpenLayers circle styles on one feature—halo, rimmed ring and core dot—ordered deterministically with zIndex in Angular.
Geometries drawn on a plain canvas
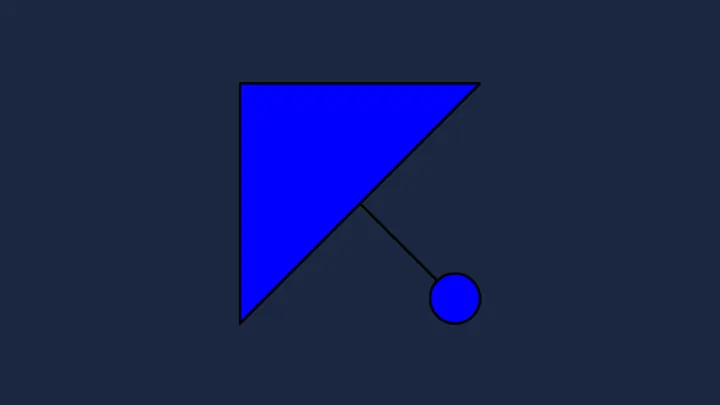
Draw OpenLayers vector geometries and styles directly onto a standalone HiDPI HTML5 canvas using the immediate toContext API without a map view.
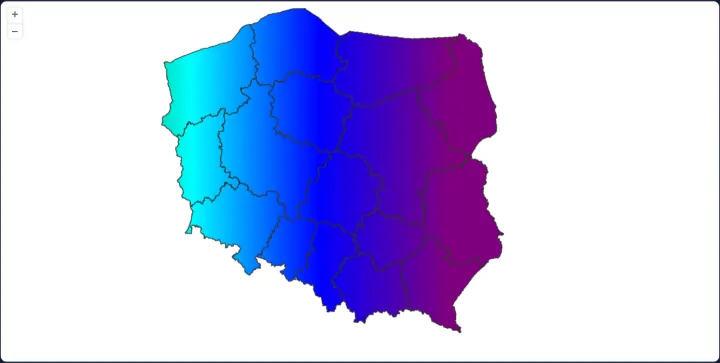
A gradient fill in canvas pixels
Fill Polish voivodeship polygons with a device-pixel-scaled HTML5 CanvasGradient in an OpenLayers Fill style over a clean white layer background.
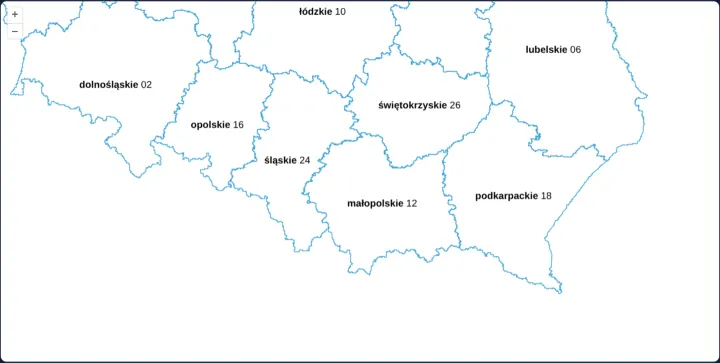
Labels in two fonts
Label Polish voivodeships in OpenLayers with multi-font rich text arrays pairing bold province names with regular-weight two-digit TERYT codes.
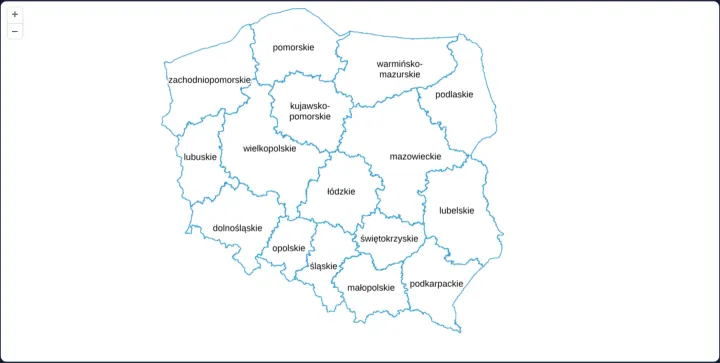
Decluttered polygon labels
Keep dense Polish voivodeship polygon labels readable across zoom levels in OpenLayers by combining layer decluttering with text overflow: true.
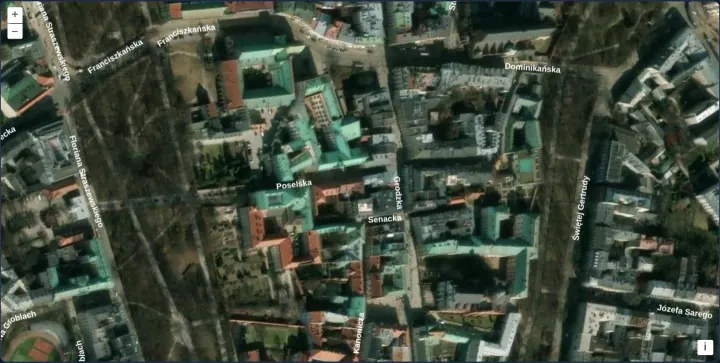
Street names along the streets
Render curved street names along Kraków Old Town road centrelines over Esri satellite imagery in OpenLayers using line placement and decluttering.
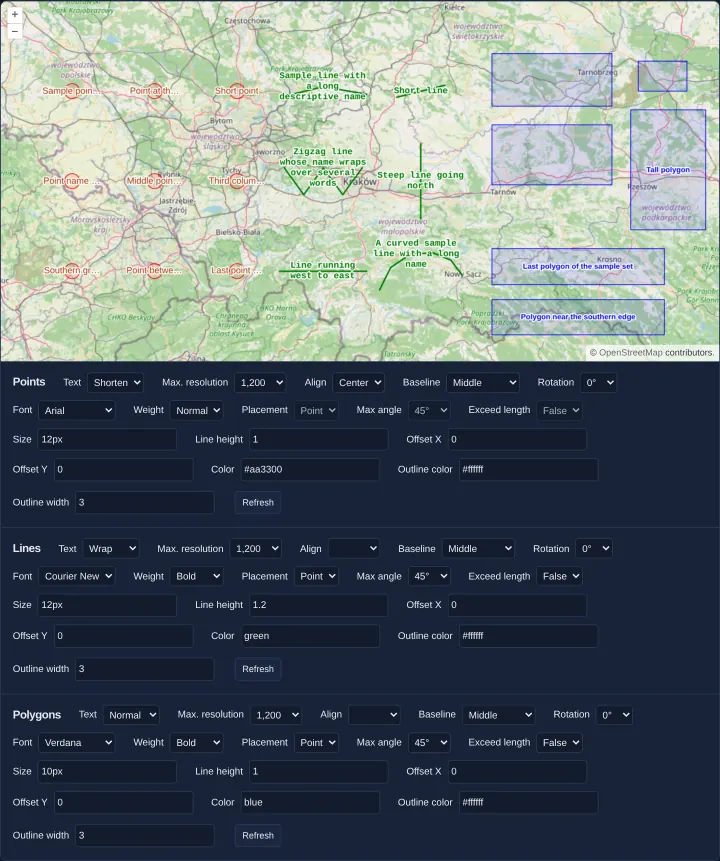
Text style options for points, lines and polygons
Explore interactive OpenLayers Text style options—fonts, offsets, wrapping, max resolution, line placement and web fonts—on points, lines and areas.
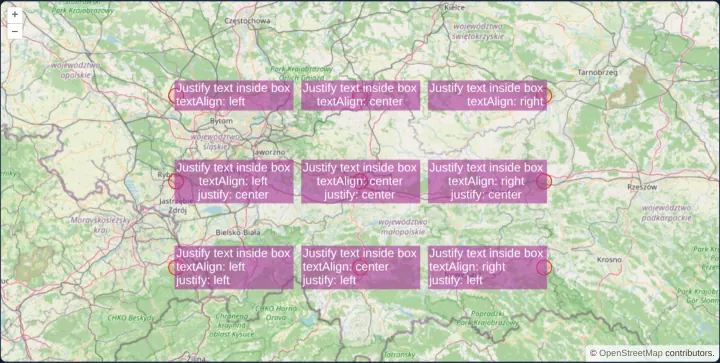
Alignment and justification of label boxes
Compare textAlign box positioning and multi-line text justification independently across nine styled callout badges in OpenLayers around Kraków.
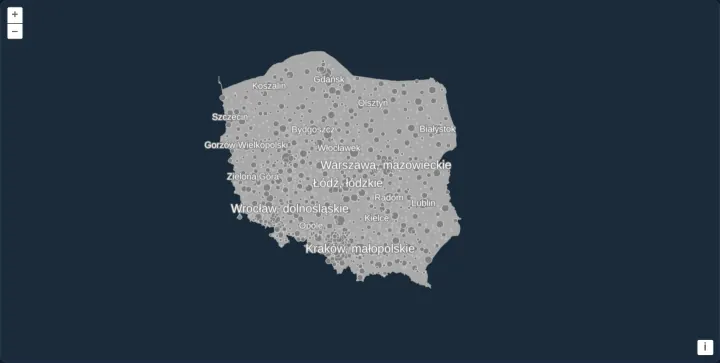
Rule-based flat styles with expressions
Style 1,027 Polish towns declaratively in OpenLayers with data-driven flat style expressions for rank-based circle radii and population labels.
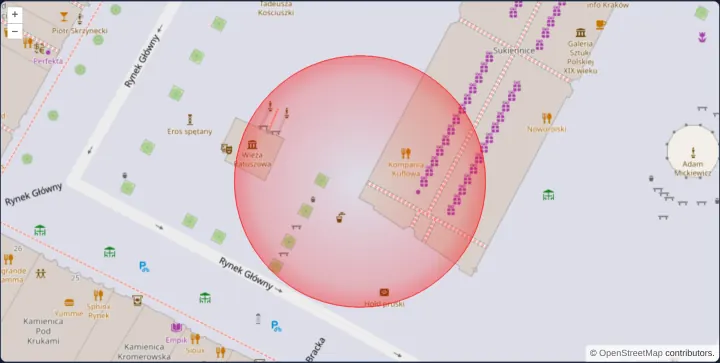
A circle drawn by a custom renderer
Draw a radial-gradient halo circle on Kraków’s Main Market Square using a custom OpenLayers Style renderer function and Canvas 2D pixel drawing.
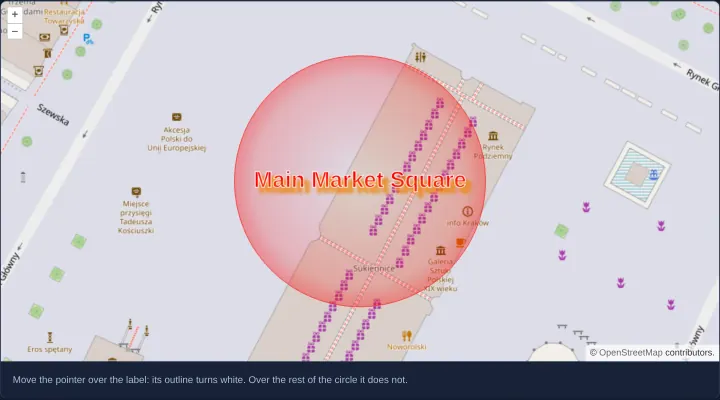
A hit area of its own for a custom renderer
Separate visual Canvas 2D rendering from pointer hit-testing in OpenLayers with a dedicated hitDetectionRenderer targeting only the text label.
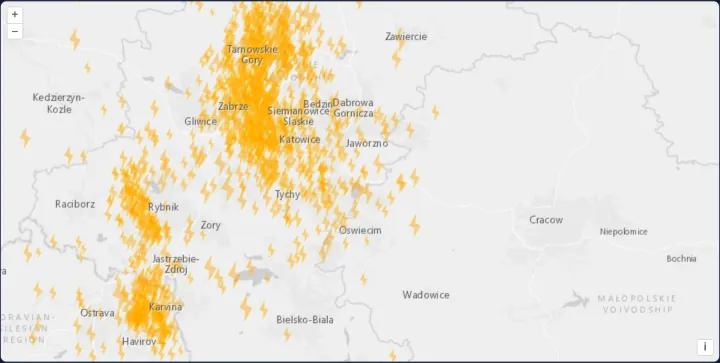
Custom symbols drawn once per magnitude
Pre-render crisp HiDPI lightning-bolt symbols per magnitude onto off-screen canvases with toContext and cache them across 1,130 KML earthquakes.
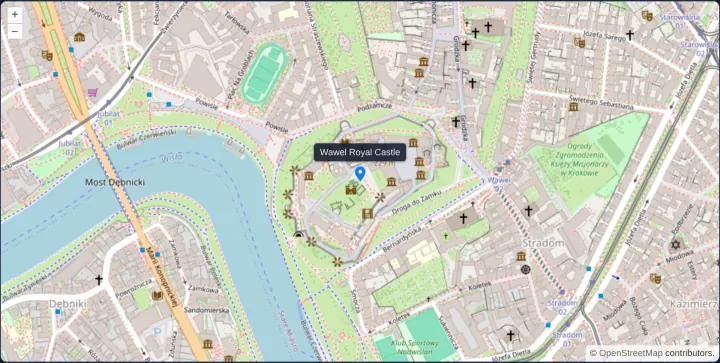
An icon with a popup on click
Place a pixel-anchored OpenLayers Icon marker on Wawel Royal Castle that opens an HTML popup on click and dismisses it automatically on map move.
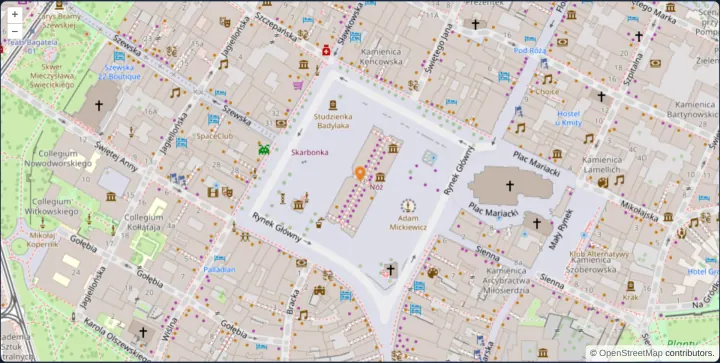
An icon drawn as its negative when selected
Highlight a selected OpenLayers marker by inverting its RGB image pixels once on an off-screen canvas using getImageData and caching the result.
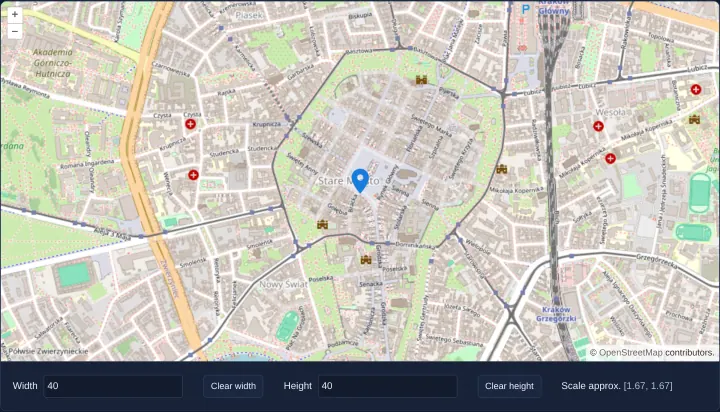
Icon width and height in pixels
Size an OpenLayers SVG marker directly by pixel width and height bindings while preserving aspect ratio when either dimension is cleared in UI.
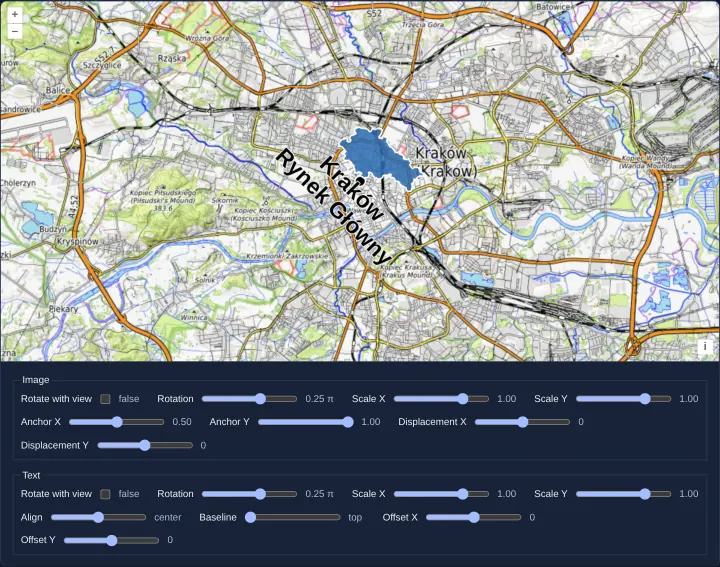
Scale, rotation and anchor of icons and labels
Stretch, mirror with negative scale, rotate around a custom anchor and synchronize view rotation on OpenLayers icons and multi-line text labels.
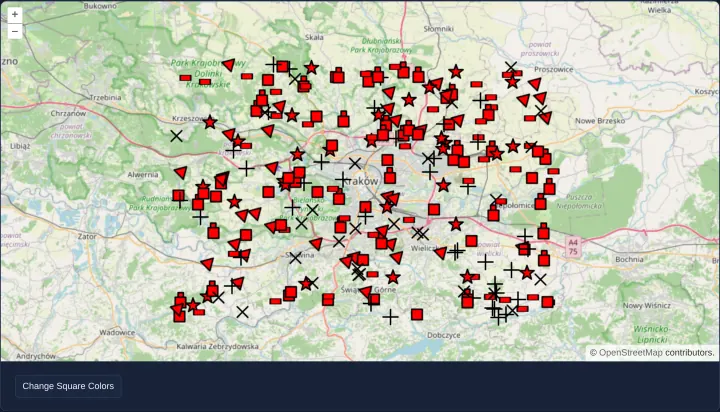
Regular shapes as point symbols
Render 250 crisp geometric markers—stars, crosses, triangles, squares, rectangles and stacked shapes—using OpenLayers RegularShape styles.
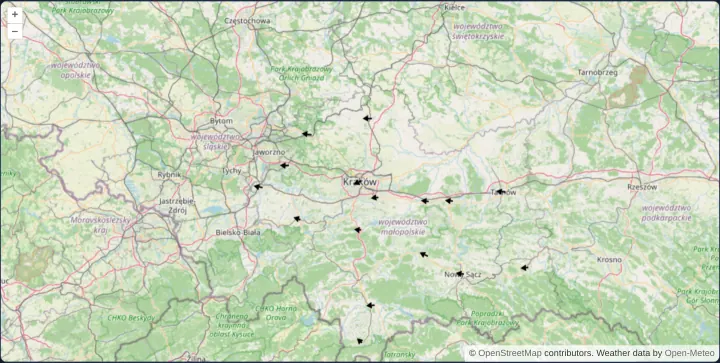
Wind arrows from regular shapes
Visualize live Open-Meteo wind speed and direction across 16 Małopolska towns in OpenLayers by scaling and rotating two shared RegularShapes.
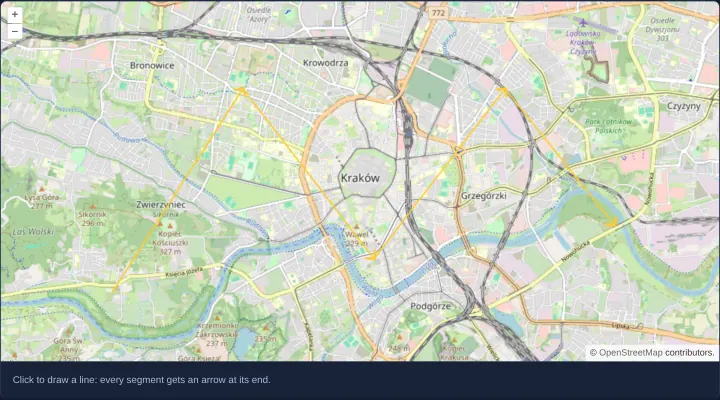
Arrows at the end of every segment
Draw interactive polylines over Kraków in OpenLayers with directional arrowheads automatically placed and rotated at the end of every segment.
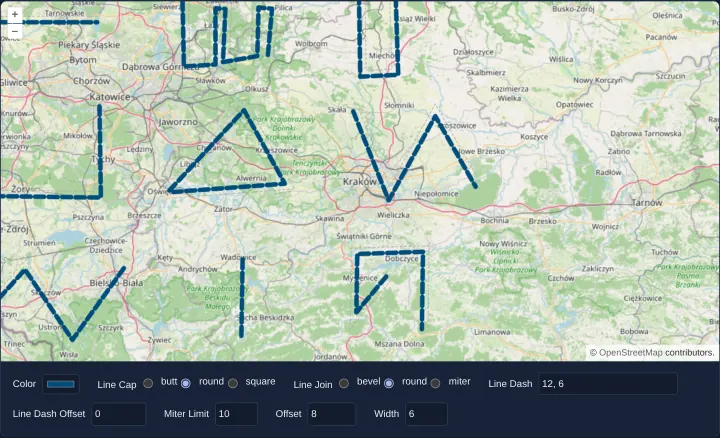
Stroke options of a line style
Test every OpenLayers Stroke option live—width, color, cap, join, miterLimit, dash pattern and lateral pixel offset—with draw, modify and snap.
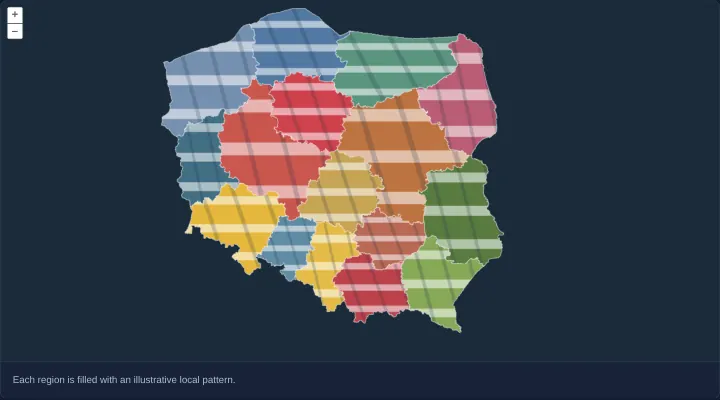
Fill regions with local artwork
Clip custom decorative SVG artwork to Polish voivodeship polygon boundaries in OpenLayers using a Canvas 2D Style renderer and save/restore.
Interactions
30 examplesDraw, modify, select, snap, trace, translate and measure features, and find the features under the pointer.
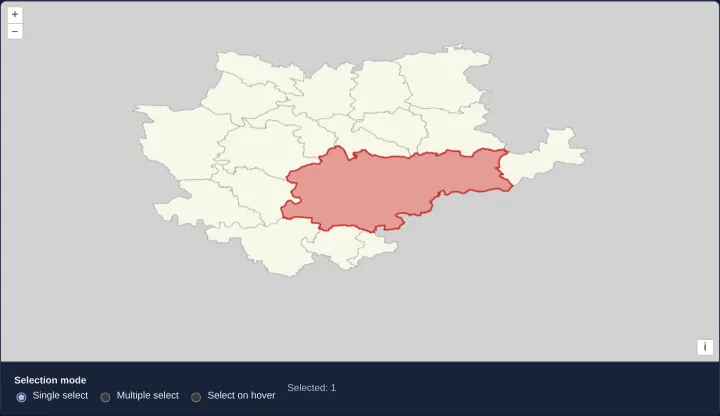
Select vector-tile features
Highlight single or multiple polygons across tile seams in OpenLayers vector tiles on click or hover using stable feature IDs and selection layers.
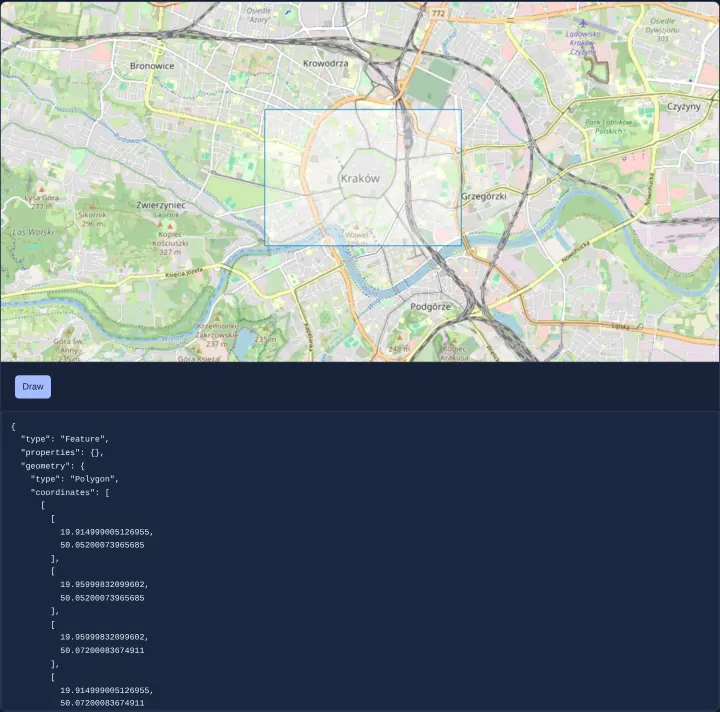
Draw a rectangle and read its GeoJSON
Draw a two-click bounding rectangle on an OpenLayers map using createBox() and export a cloned geometry as WGS84 GeoJSON in Angular and React.
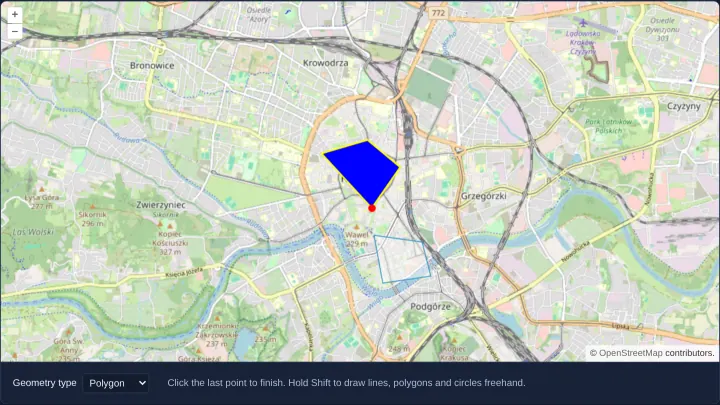
Style the sketch while drawing
Customize the active in-progress sketch appearance in OpenLayers Draw interaction per geometry type using flat circle, stroke and fill styles.
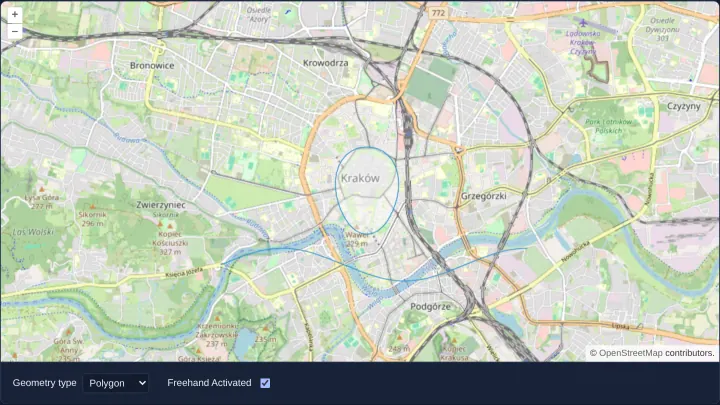
Draw freehand lines, polygons and circles
Sketch smooth freehand lines, polygons and circles by dragging a mouse, finger or stylus in OpenLayers and toggle back to click-vertex mode.
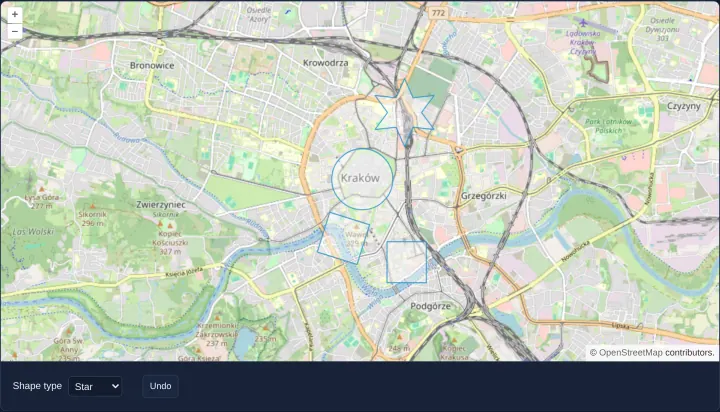
Draw squares, boxes and stars
Draw oriented squares, axis-aligned boxes, circles and custom 12-vertex stars in OpenLayers using Circle Draw interactions, geometryFunction and Undo.
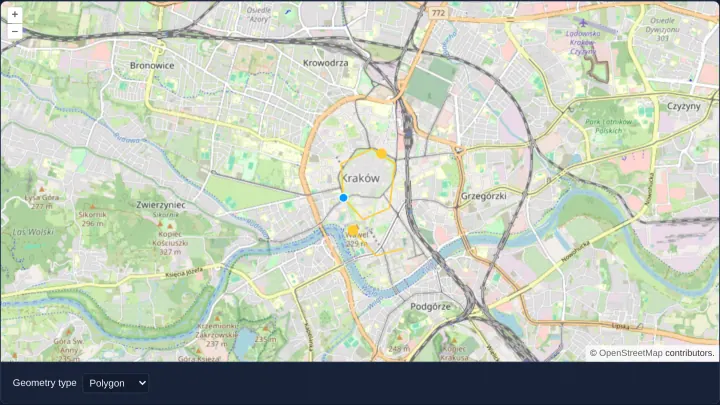
Draw and edit points, lines, polygons and circles
Combine OpenLayers Draw, Modify and Snap interactions on one shared vector source to sketch, connect and edit points, lines, areas and circles.
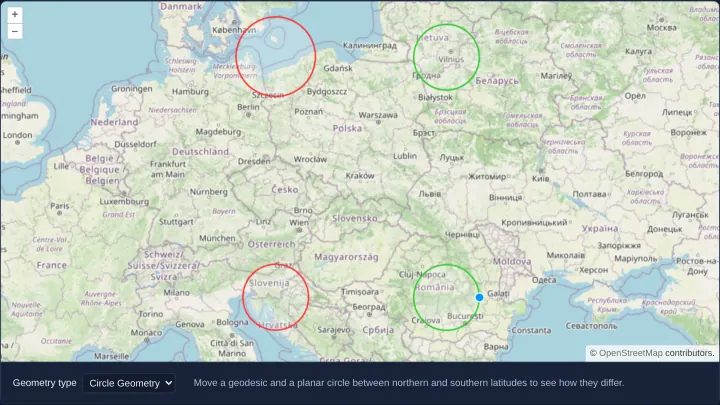
Geodesic circles beside planar ones
Draw and edit true-scale geodesic circles in metres alongside planar Web Mercator circles in OpenLayers using spherical circular() polygons.
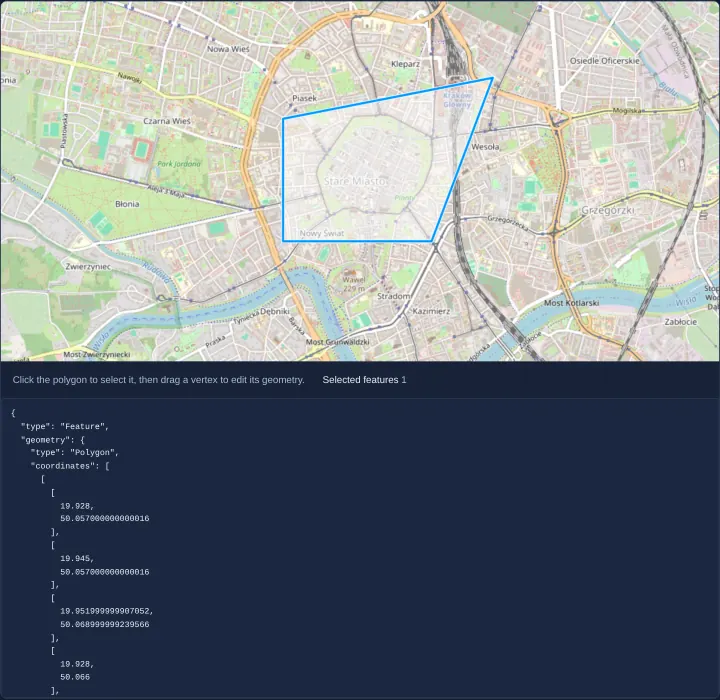
Edit a polygon and read its GeoJSON
Select an OpenLayers polygon on click, drag its vertices or edges to reshape it with Modify, and serialize updated WGS84 GeoJSON into state.
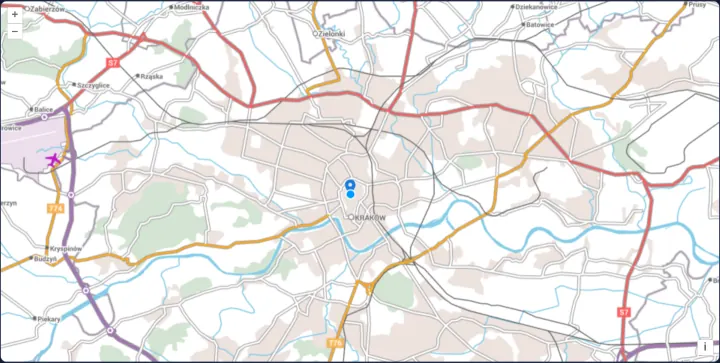
Drag an icon to another place
Drag a tall SVG map pin smoothly by any painted pixel of its icon in OpenLayers using Modify hitDetection and grab/pointer cursor feedback.
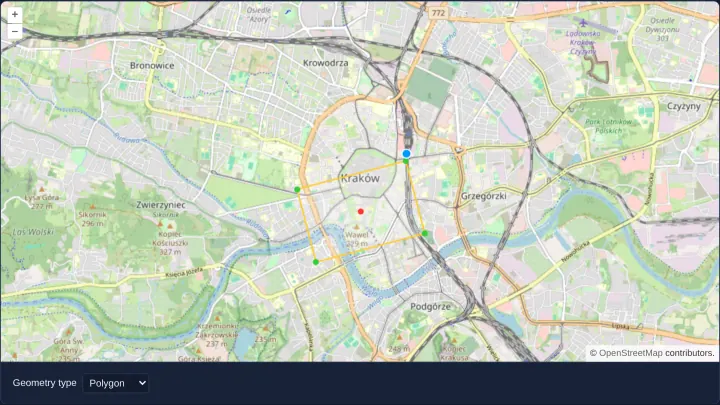
Scale and rotate shapes by a vertex
Scale and rotate OpenLayers polygons and lines around their centroid by dragging outer vertices, or translate whole shapes with Ctrl/Cmd-drag.
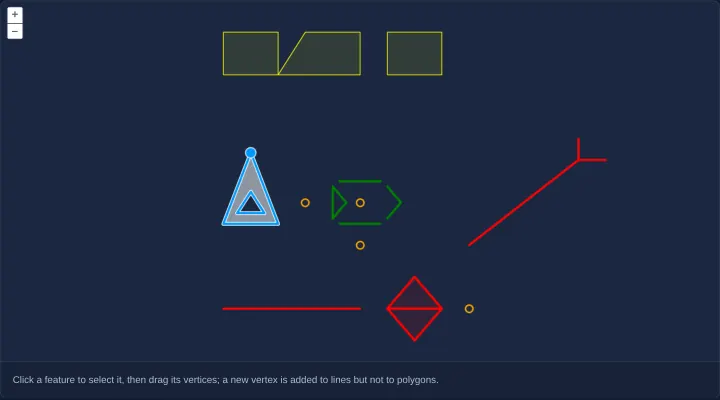
Edit every kind of geometry
Select and edit Points, LineStrings, holed Polygons, multi-part geometries and GeometryCollections in OpenLayers with vertex-insertion guards.
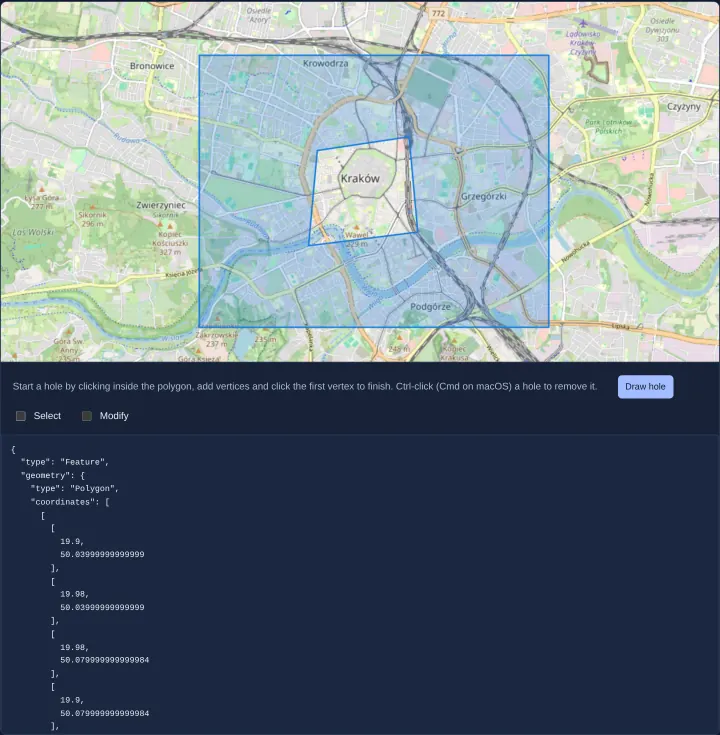
Cut a hole in a polygon
Cut interior exclusion holes inside existing OpenLayers polygons and remove them with Ctrl/Cmd-click using cc-openlayers while exporting GeoJSON.
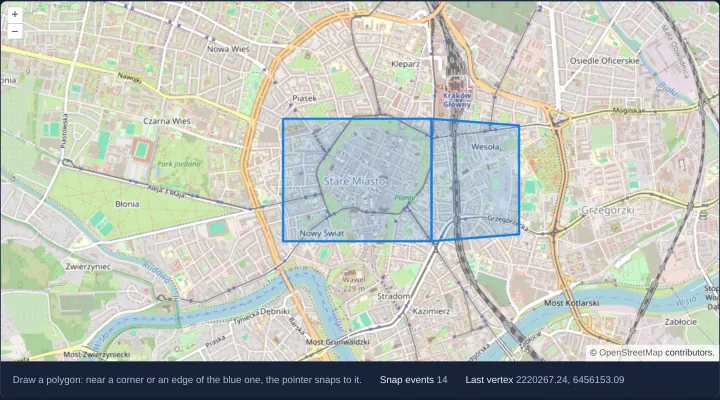
Snap new shapes to existing ones
Snap newly drawn OpenLayers polygon vertices and edges cleanly to existing features within a 20px tolerance while tracking live snap events.
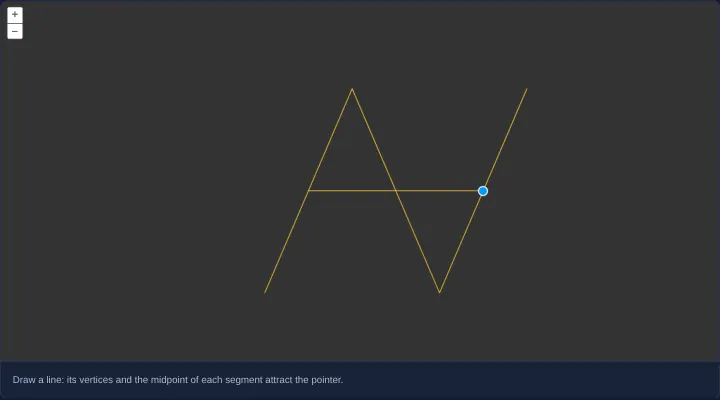
Snap to the middle of segments
Snap drawn and edited lines in OpenLayers to exact segment midpoints as well as vertices and edges using a custom Snap segmenters function.
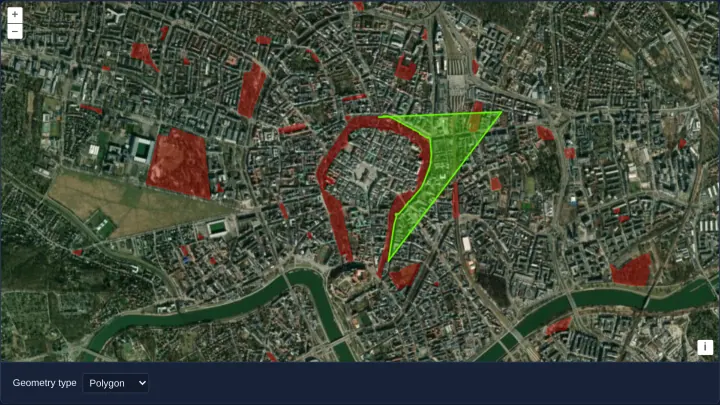
Trace the edges of Kraków's parks
Trace exact park and Planty polygon boundaries around Kraków’s Old Town in OpenLayers with two clicks using Draw trace and traceSource options.
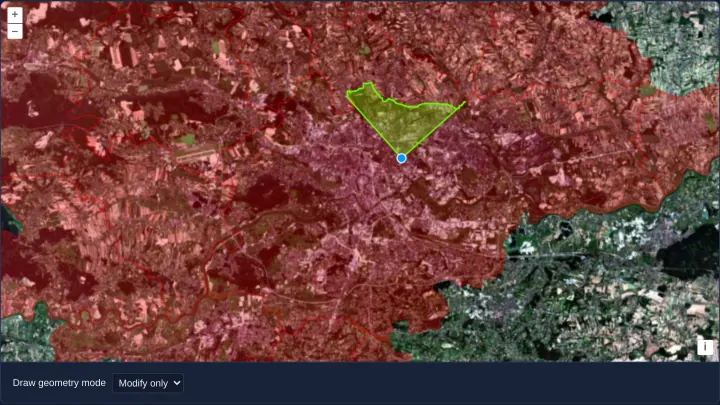
Trace borders while drawing and editing
Trace official PRG municipal borders around Kraków during both initial polygon drawing and subsequent Modify vertex editing in OpenLayers.
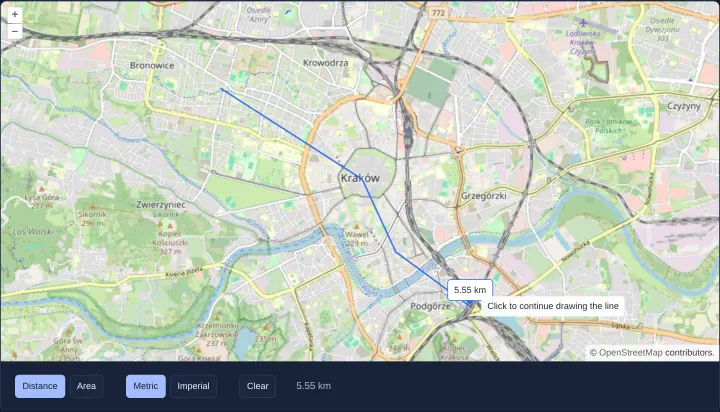
Measure distances and areas
Measure spherical route distances and land-parcel areas in metric or imperial units using cc-openlayers aol-interaction-measure in Angular.
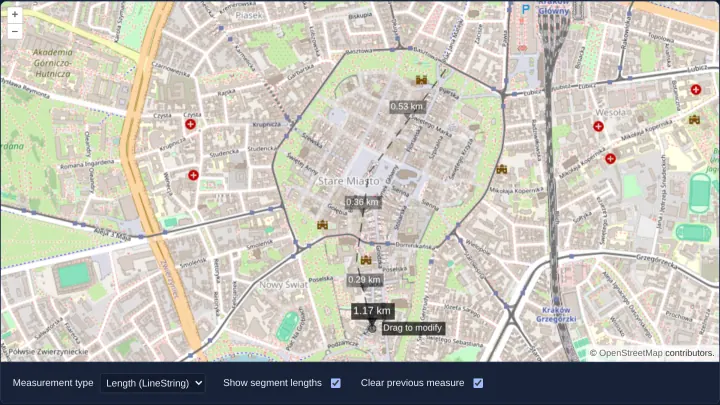
Measure with labels drawn as styles
Measure spherical distances and areas in OpenLayers using vector Text styles for totals, per-segment lengths and live cursor guidance tips.
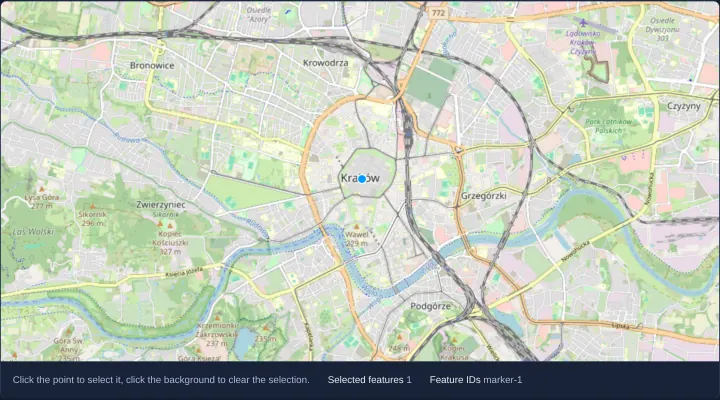
Select features with a click
Select vector features on click in OpenLayers restricted to a target marker layer via a layers filter and track selected feature IDs in signals.
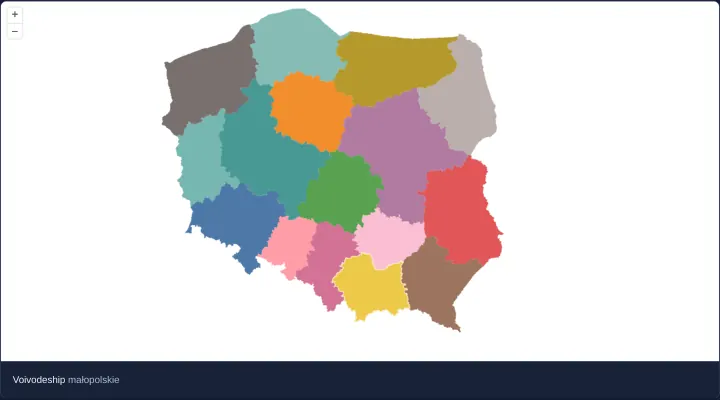
Select features on hover
Highlight Polish voivodeship polygons dynamically on pointer hover in OpenLayers by configuring Select interaction condition as pointerMove.
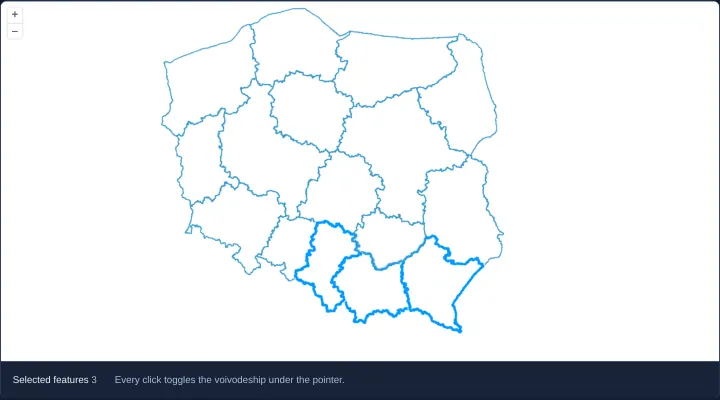
Select several features with clicks
Toggle multiple Polish voivodeship polygons in and out of selection with single clicks in OpenLayers using toggleCondition always and multi.
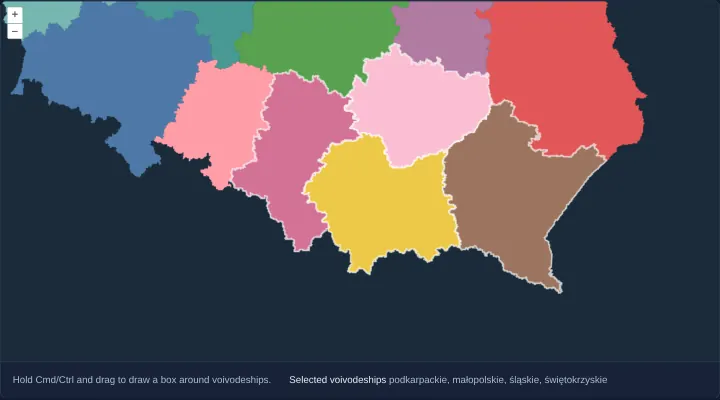
Select features with a box
Select multiple OpenLayers polygons by Ctrl/Cmd-dragging a marquee box—even on rotated views—using DragBox, getFeaturesInExtent and geometry tests.
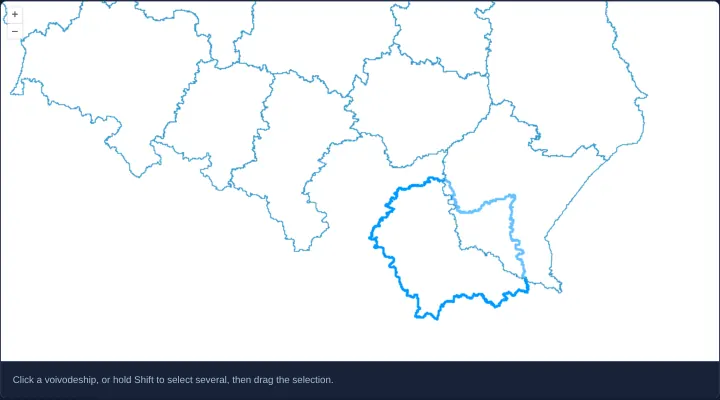
Move selected features with a drag
Drag single or Shift-selected OpenLayers polygons to new locations as rigid shapes by binding aol-interaction-translate to selected features.
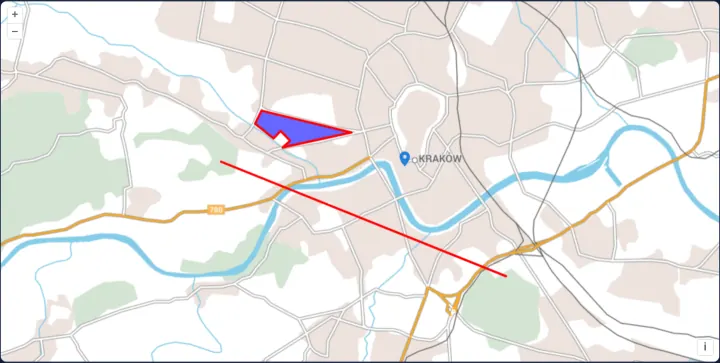
A custom drag interaction
Build a custom OpenLayers feature-dragging interaction declaratively in Angular and React using four arrow-function Pointer event handlers.
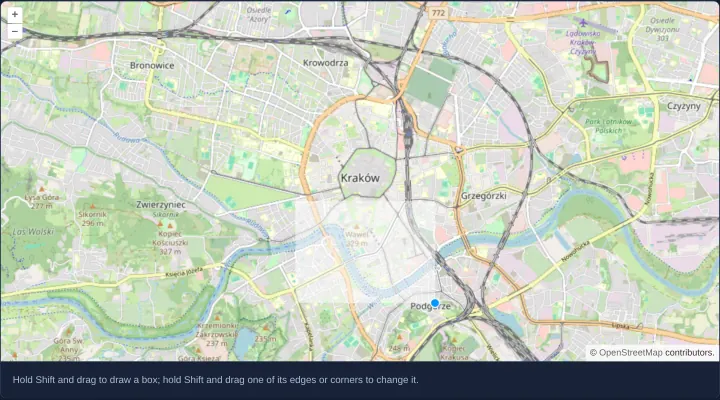
Draw and resize a box with Shift
Draw and resize an interactive bounding box with Shift-drag in OpenLayers using ExtentInteraction while keeping unmodified drags for panning.
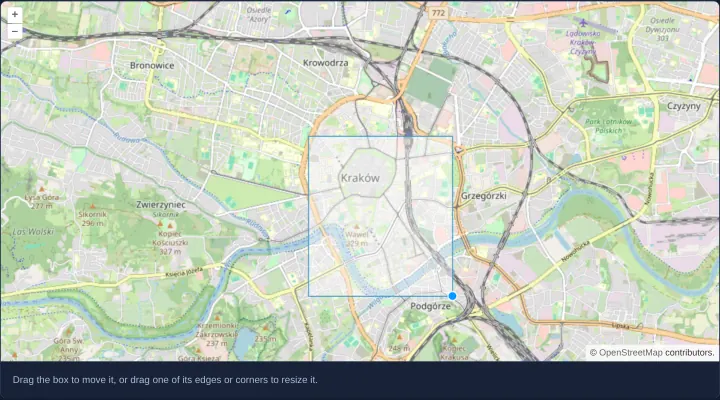
Move and resize a given box
Pre-populate a draggable, edge-resizable bounding box in OpenLayers while disabling new box creation via createCondition never and drag true.
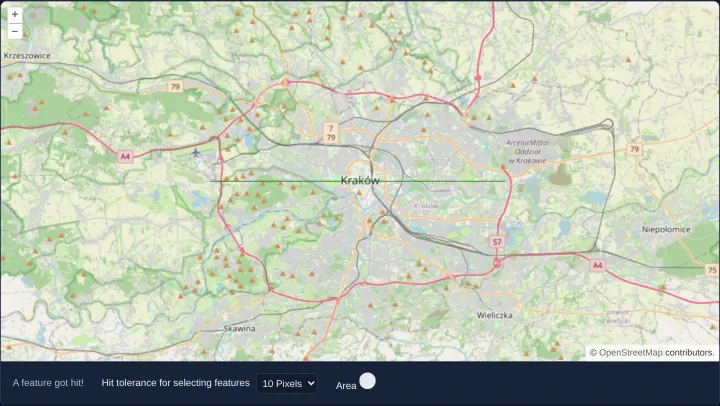
Hit a thin line with a tolerance
Make thin 1-pixel vector lines easy to tap and click in OpenLayers by passing a CSS-pixel hitTolerance radius to forEachFeatureAtPixel.
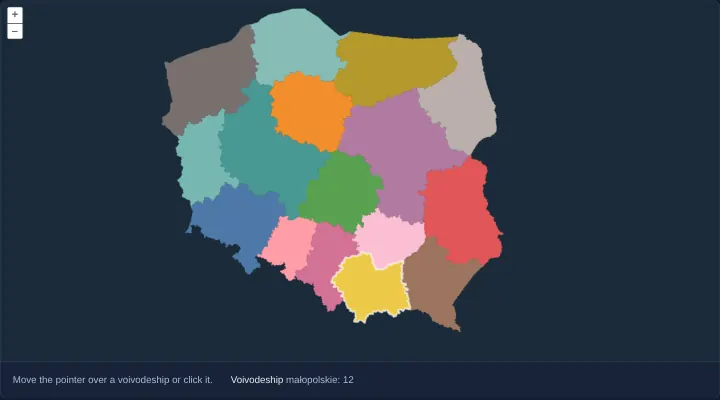
Find features with a layer's hit detection
Accelerate high-frequency hover hit-testing over dense polygons in OpenLayers using asynchronous layer.getFeatures() and highlight overlays.
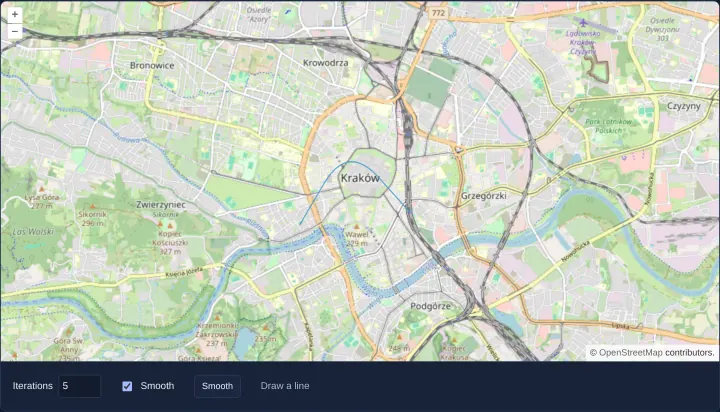
Smooth a drawn line
Sketch polylines over Kraków in OpenLayers and smooth sharp corners iteratively using the Chaikin corner-cutting algorithm in Angular and React.
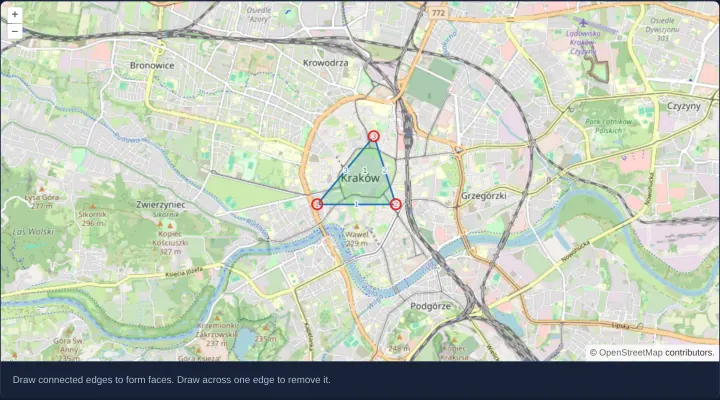
Edit a connected planar topology
Draw and edit connected planar topology graphs—nodes, shared edges and polygon faces—in OpenLayers using Topolis, edge snapping and cleanup.
Overlays and animation
7 examplesPopups, tooltips and HTML overlays, animated features and a marker moving along a route.
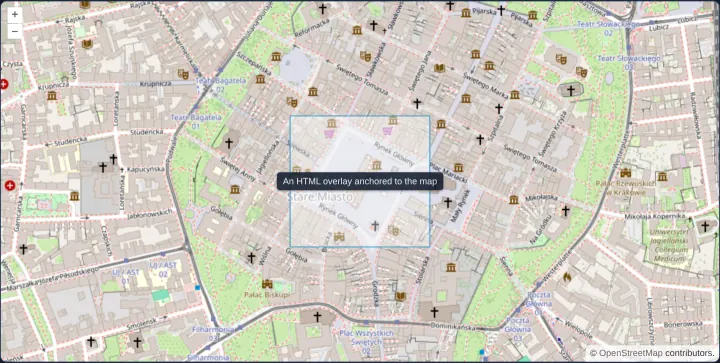
An HTML overlay on the map
Anchor live Angular or React HTML markup directly to a WGS84 map coordinate in OpenLayers using aol-overlay, positioning and stopEvent false.
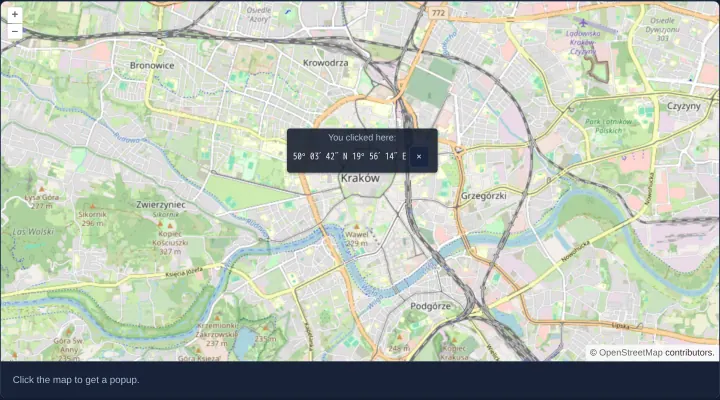
A popup at the clicked place
Open a dismissible coordinate popup at clicked map locations in OpenLayers with HDMS formatting and smooth 250 ms autoPan viewport margining.
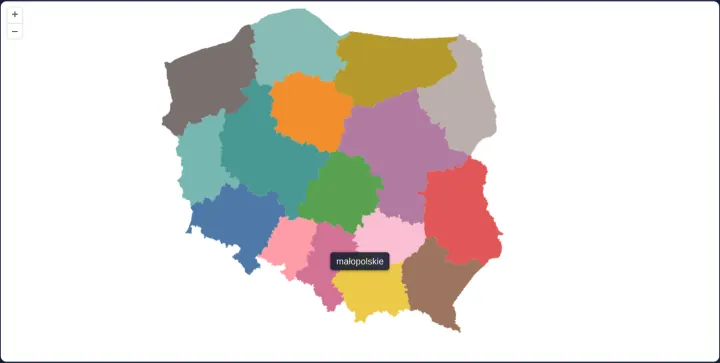
A tooltip that follows the pointer
Follow the pointer with a non-blocking HTML hover tooltip naming Polish voivodeships in OpenLayers while supporting touch taps and UI controls.
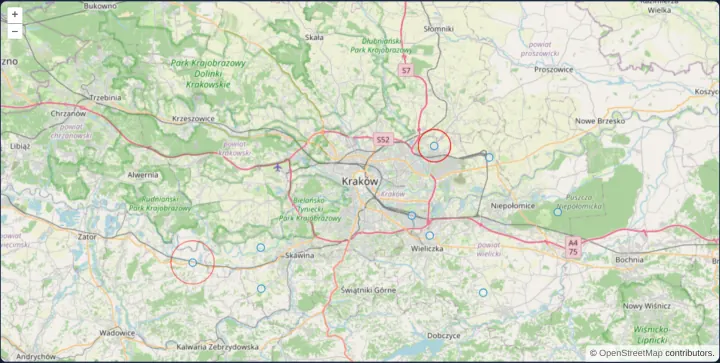
Flash each new point with a ring
Animate expanding easeOut pulse rings around newly arriving OpenLayers point features in a single shared postrender loop using getVectorContext.
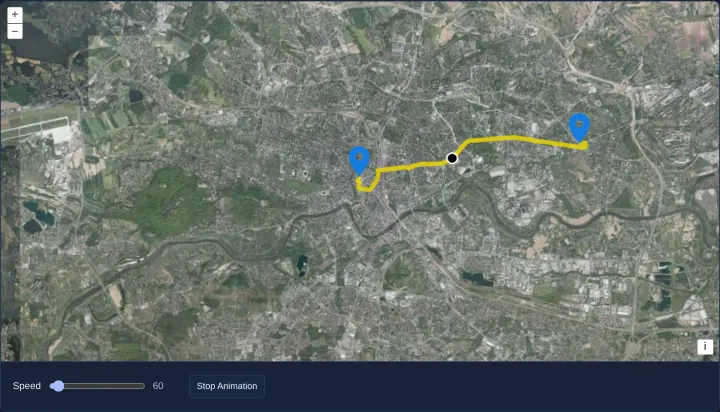
A marker moving along a route
Animate a marker smoothly out and back along a decoded Polyline route in OpenLayers using delta-time postrender updates and a speed slider.
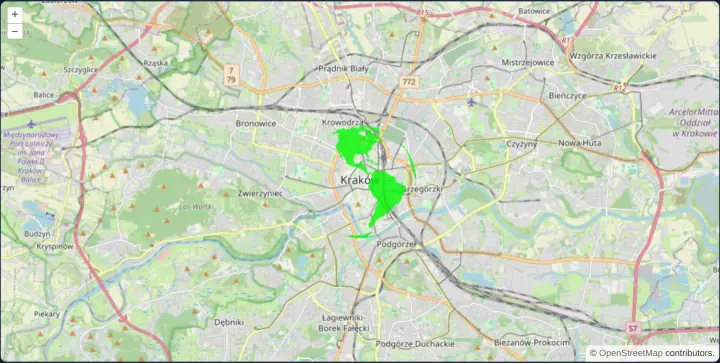
Animated globe marker
Render an animated spinning globe GIF as an OpenLayers point Icon symbol in Angular and React while keeping map panning and zooming smooth.
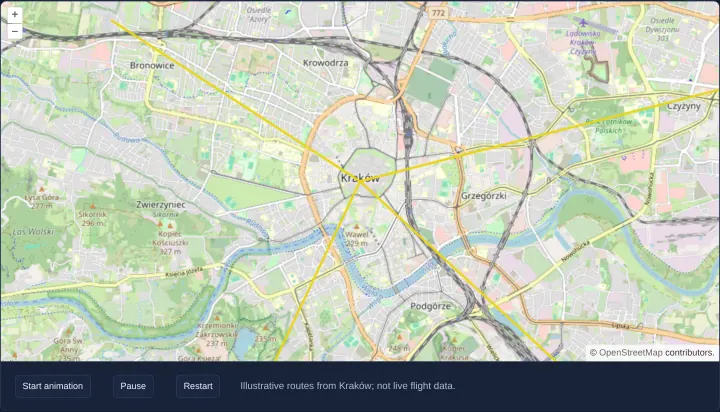
Animate illustrative flight routes
Animate great-circle flight arcs from Kraków in OpenLayers with the arc library, using shared animation helpers behind Start, Pause and Restart buttons.
Raster, GeoTIFF and WebGL
44 examplesCloud Optimized GeoTIFFs, band math and tile styles, raster operations, heatmaps and WebGL layers for points, lines and tiles.
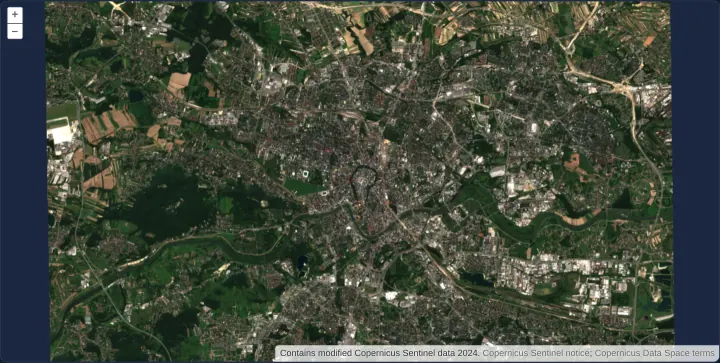
Retina image tiles on a logical XYZ grid
Render 512-pixel @2x Retina WebP satellite tiles on a standard 256-pixel logical XYZ grid over Kraków using OpenLayers ImageTile and WebGL.
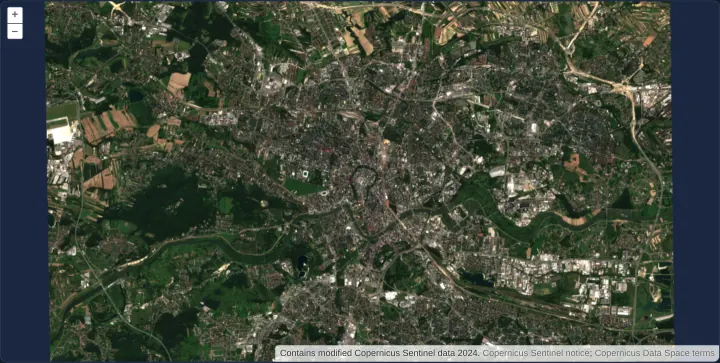
WMTS image density selected for the device
Select 256-pixel standard or 512-pixel HiDPI WMTS layers from GetCapabilities based on devicePixelRatio while sharing one 256px TileMatrixSet.
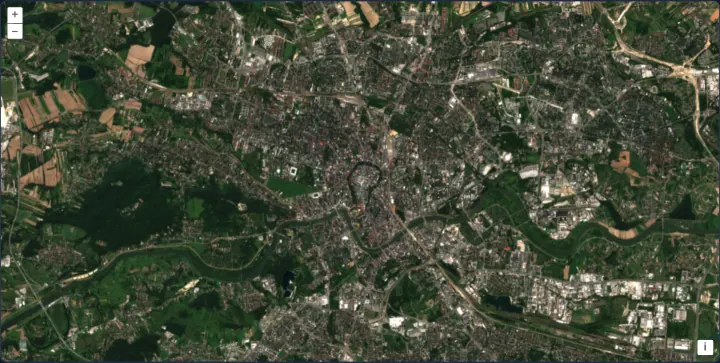
A Cloud Optimized GeoTIFF in a WebGL layer
Stream a Sentinel-2 Cloud Optimized GeoTIFF directly in OpenLayers WebGL using HTTP range reads, native UTM GeoKeys view setup and overzooming.
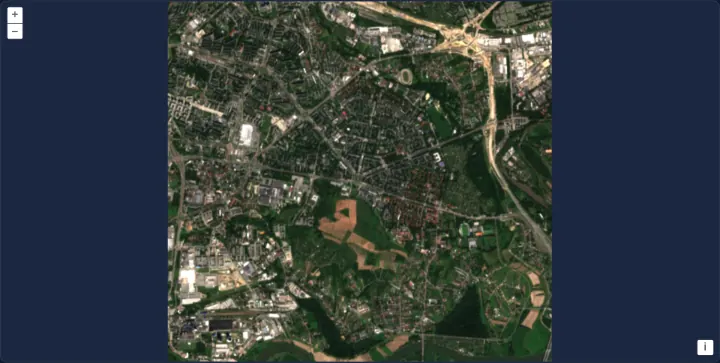
A GeoTIFF read from a Blob
Render an in-memory GeoTIFF Blob directly in an OpenLayers WebGL layer with zero server uploads, full-extent view fitting and SSR PendingTasks.
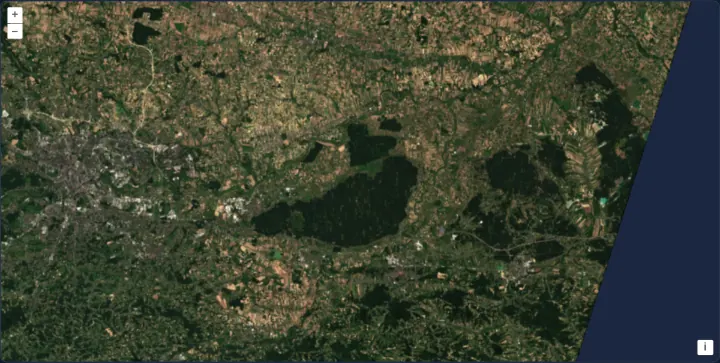
A GeoTIFF fetched through your own loader
Fetch Cloud Optimized GeoTIFF byte ranges through a custom OpenLayers HTTP loader hook for auth headers, retries or caching, keeping Range requests intact.
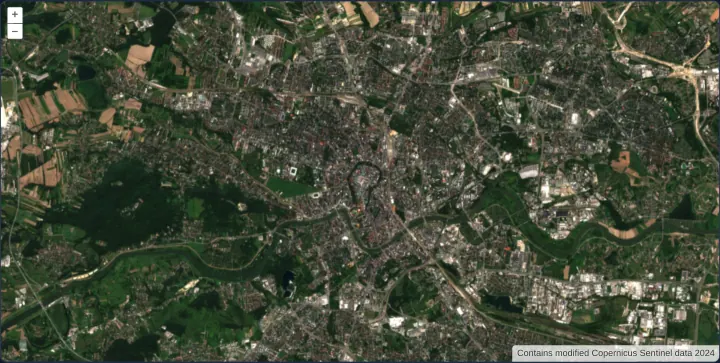
A local pyramid of Cloud Optimized GeoTIFFs
Stream a multi-file 5-level Cloud Optimized GeoTIFF pyramid over Kraków in OpenLayers using sourcesFromTileGrid for extent and scale selection.
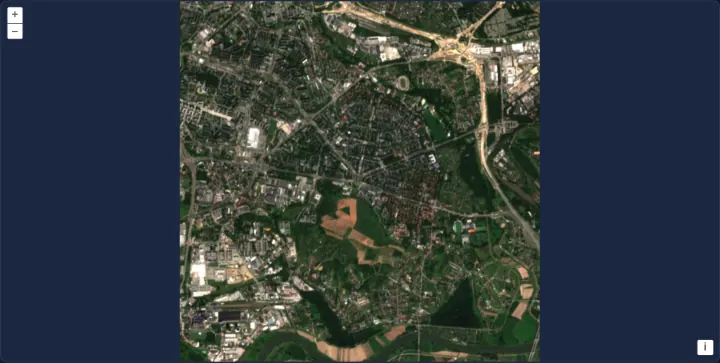
A GeoTIFF with its overviews in a separate file
Pair a full-resolution GeoTIFF with an external .ovr overview file in OpenLayers so zoomed-out WebGL views fetch lightweight downsampled tiles.
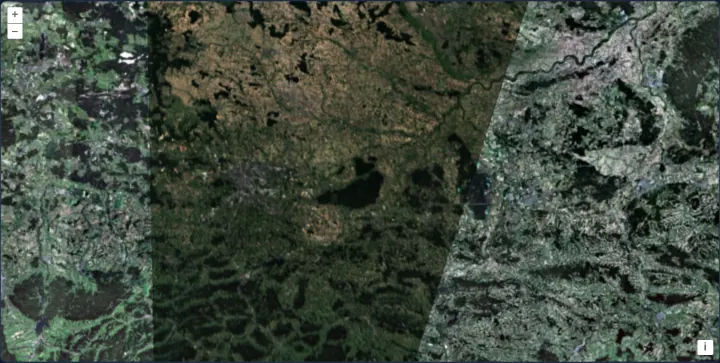
A GeoTIFF in its own projection over an orthophoto
Overlay a UTM 34N Sentinel-2 GeoTIFF onto a Web Mercator WMTS orthophotomap in OpenLayers with automatic GeoKeys CRS detection and gamma style.
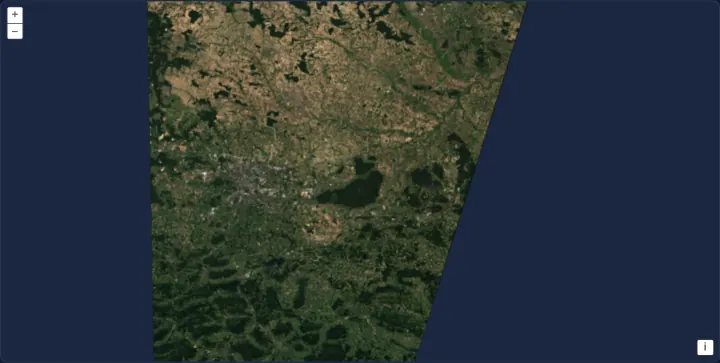
A GeoTIFF reprojected to Web Mercator
Reproject a UTM zone 34N Sentinel-2 Cloud Optimized GeoTIFF onto a Web Mercator OpenLayers map in WebGL and recenter on viewReady metadata.
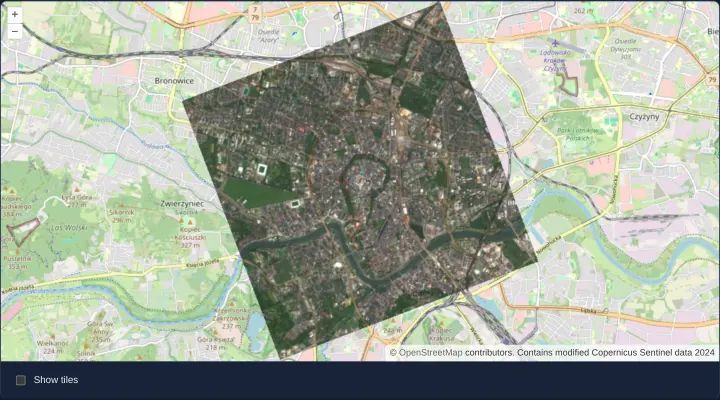
A GeoTIFF on a turned grid
Render a 20-degree rotated Sentinel-2 GeoTIFF placed by its ModelTransformation tag over OpenStreetMap in OpenLayers with rotated TileDebug.
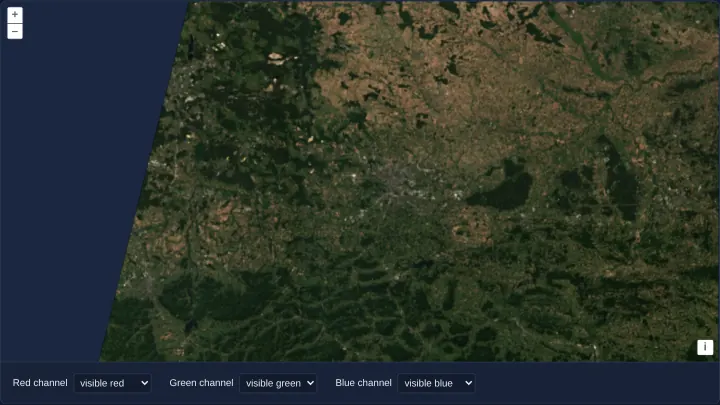
Three COGs in two UTM zones as one layer
Mosaic three Sentinel-2 Cloud Optimized GeoTIFFs across UTM zones 33N and 34N in one OpenLayers WebGLTileLayer with live band-channel selects.
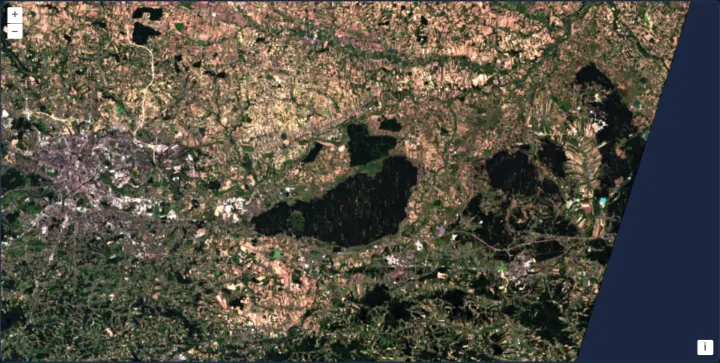
A GeoTIFF scaled band by band
Balance Sentinel-2 true-colour GeoTIFF contrast in OpenLayers without shaders by configuring independent per-band min, max and nodata arrays.
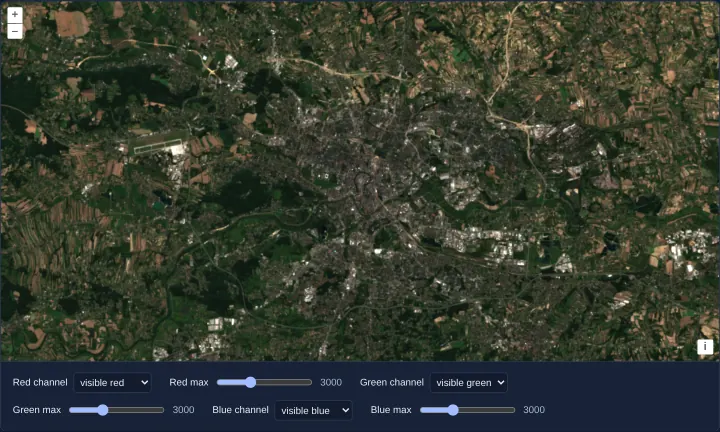
A band and a stretch for each colour channel
Assign Sentinel-2 bands and live brightness-stretch sliders to RGB channels in OpenLayers WebGL using unnormalized GeoTIFFs and style variables.
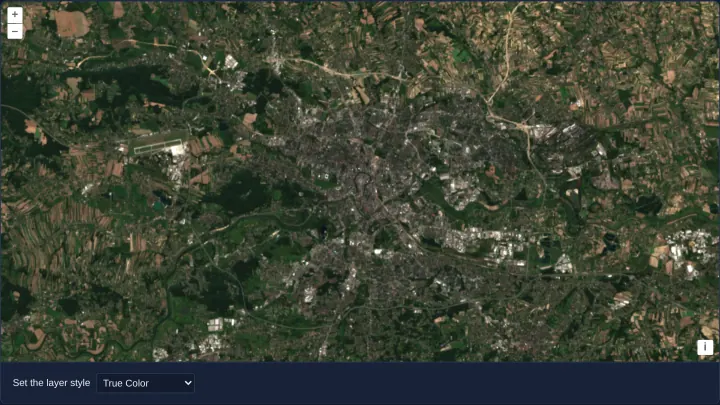
Five styles for one Sentinel-2 scene
Switch a 4-band Sentinel-2 GeoTIFF across True Color, NIR False Color, continuous NDVI ramps and discrete palette WebGL styles in OpenLayers.
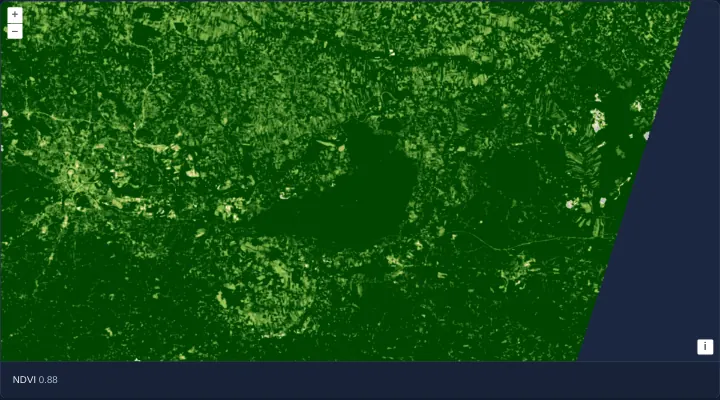
NDVI computed on the GPU
Compute Sentinel-2 NDVI on the GPU in an OpenLayers WebGL style from red and NIR COGs and inspect live pixel NDVI values via layer.getData().
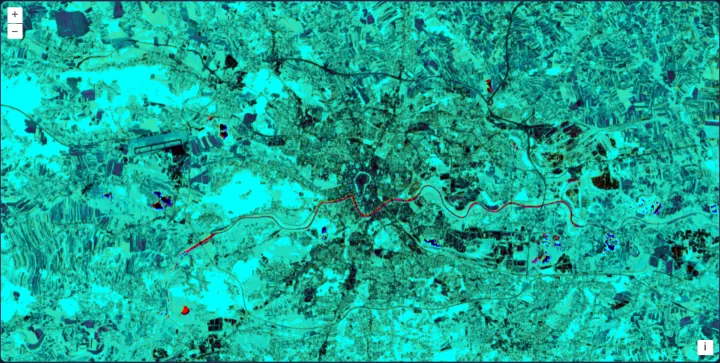
Vegetation and water from three bands
Combine 10 m and 20 m Sentinel-2 red, NIR and SWIR Cloud Optimized GeoTIFFs into one multi-index NDVI and NDWI WebGL composite in OpenLayers.
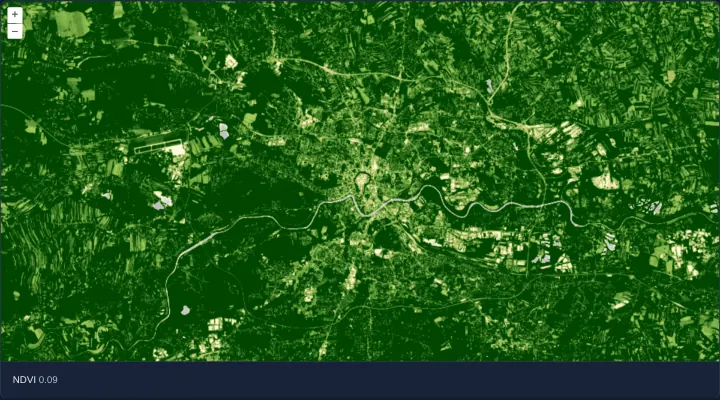
NDVI computed in a raster source
Compute Sentinel-2 NDVI per pixel inside an OpenLayers RasterSource Web Worker using unnormalized GeoTIFFs, lib helpers and getData() lookup.
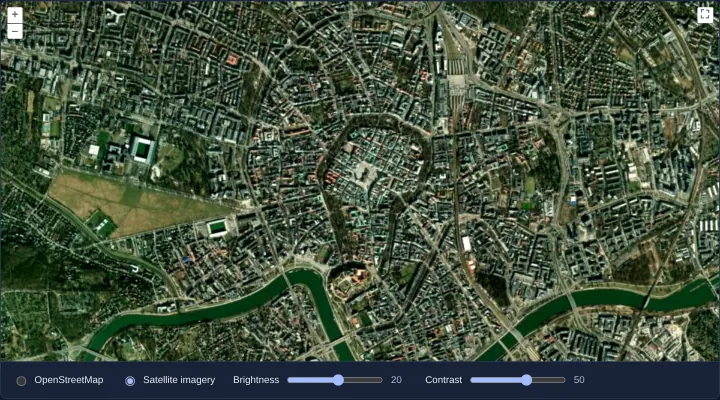
Brightness and contrast with raster operations
Adjust OpenStreetMap and satellite imagery brightness and contrast per pixel in OpenLayers using interactive RasterSource sliders in Angular.
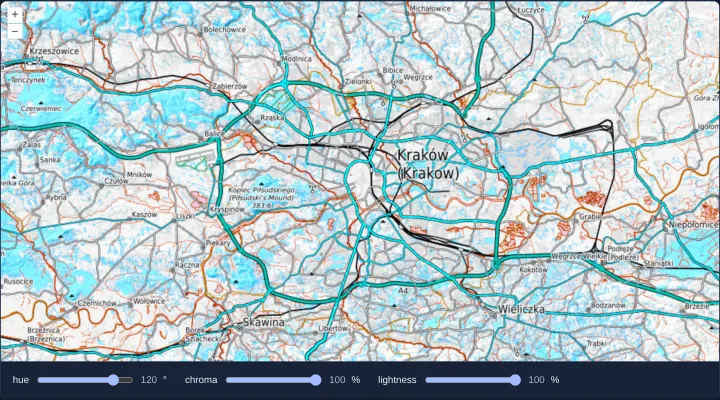
Hue, chroma and lightness of a map
Transform OpenTopoMap basemap hue, chroma and lightness perceptually in HCL colour space using an OpenLayers RasterSource worker and sliders.
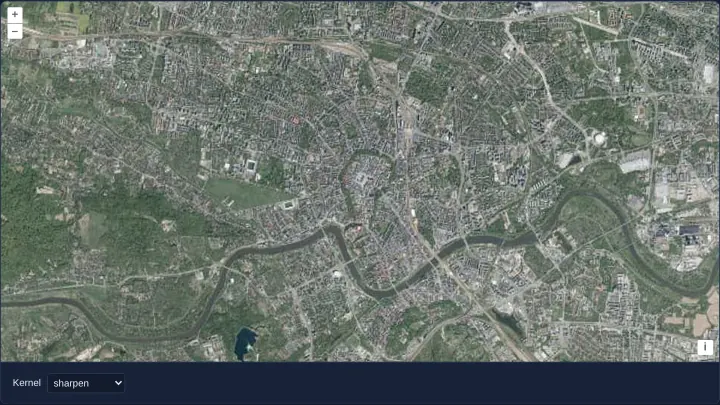
Convolution filters on an orthophoto
Apply 3x3 sharpening, blur, emboss and edge-detection convolution kernels to OpenLayers WMTS orthophotos in postrender using getImageData().
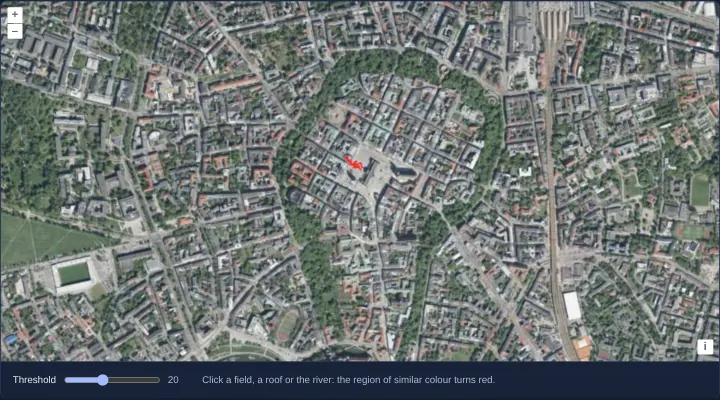
Region growing from a clicked pixel
Segment contiguous roofs, squares or fields of similar RGB colour from a clicked orthophoto pixel in OpenLayers using an image RasterSource.
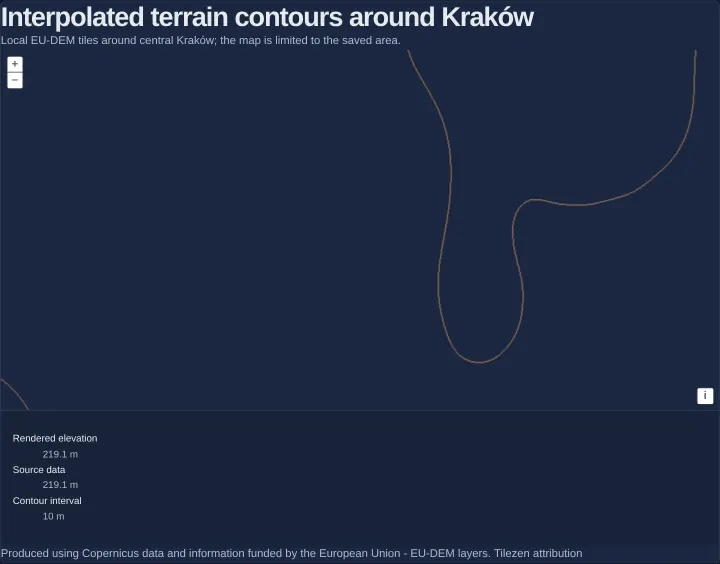
Contours from interpolated elevation data
Generate adaptive terrain contour lines from WebGL-interpolated float EU-DEM tiles in OpenLayers and compare rendered and source pixel heights.
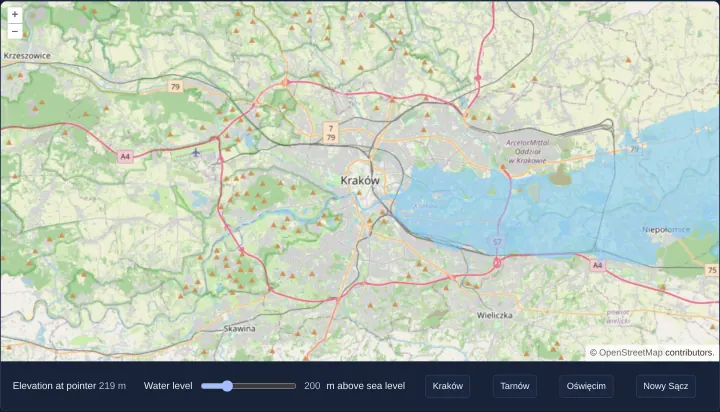
Flooding the terrain up to a water level
Simulate interactive terrain flooding around Kraków from non-interpolated Terrarium DEM tiles in an OpenLayers RasterSource with live readouts.
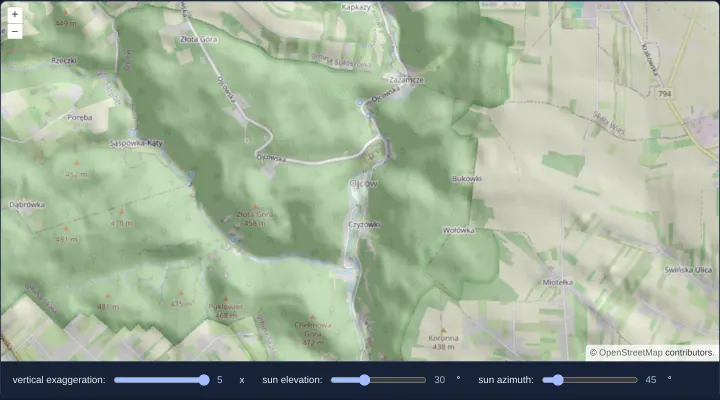
Shaded relief computed on the CPU
Compute interactive hillshade relief over Ojców’s Prądnik gorge on the CPU from Terrarium DEM tiles using an OpenLayers image RasterSource UI.
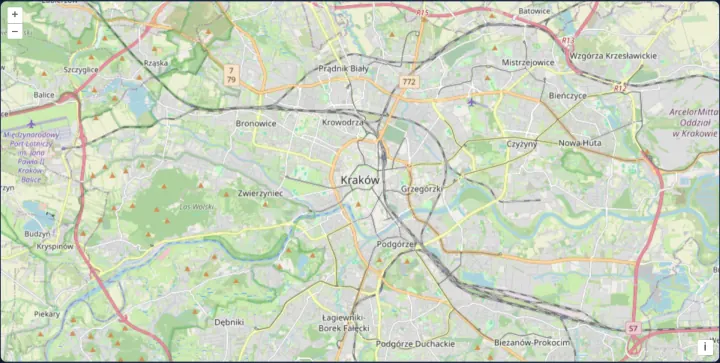
Raster tiles drawn with WebGL
Render standard OpenStreetMap XYZ raster tiles on the GPU in OpenLayers using WebGLTileLayer and CORS-enabled ImageTile sources as a baseline.
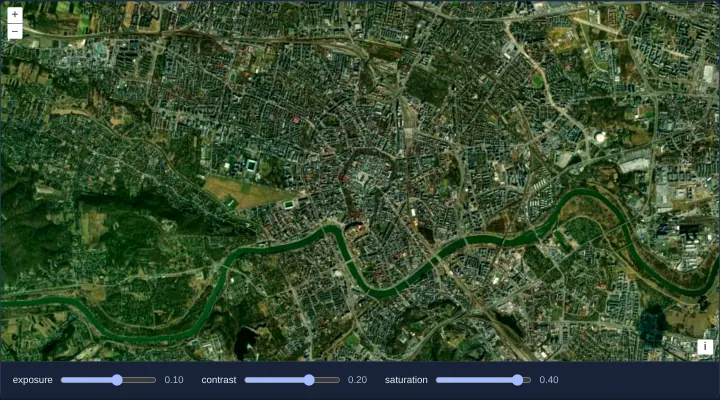
Exposure, contrast and saturation in WebGL
Tune Esri satellite imagery exposure, contrast and saturation live on the GPU in OpenLayers using reactive WebGLTileLayer style variables.
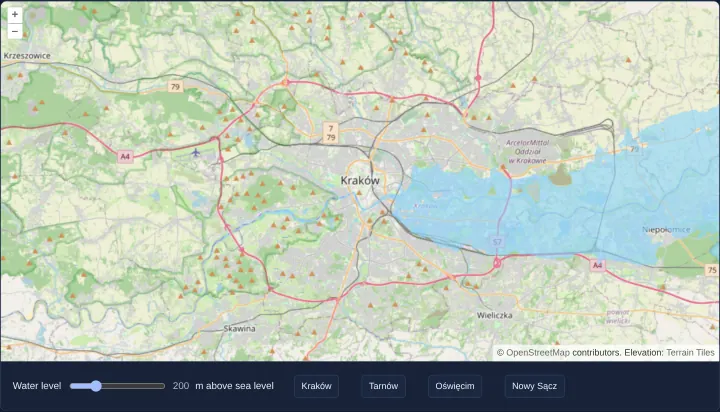
Flooding the terrain on the GPU
Simulate real-time terrain inundation on the GPU in OpenLayers by decoding Terrarium RGB elevation tiles inside a WebGLTileLayer style rule.
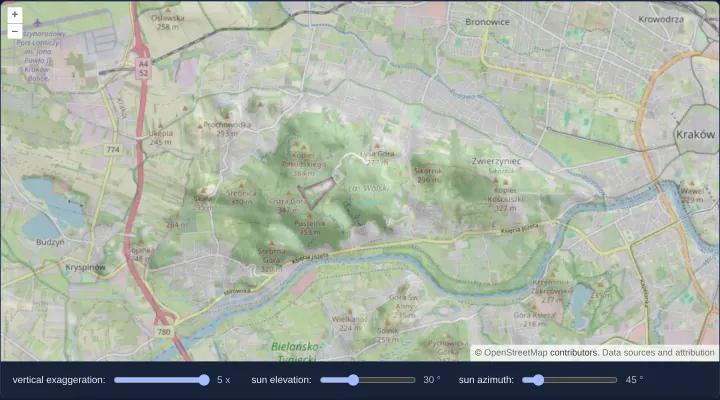
Shaded relief computed on the GPU
Compute interactive GPU hillshade relief in OpenLayers WebGLTileLayer by sampling neighbouring Terrarium elevation pixels inside shaders.
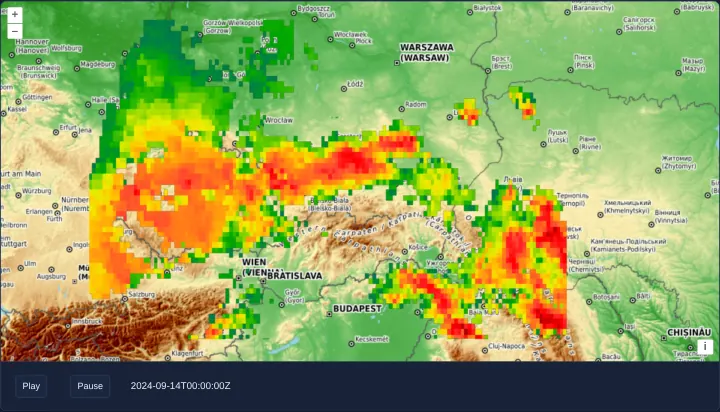
A WMS time series animated in WebGL
Animate half-hourly NASA GIBS Storm Boris WMS rainfall in OpenLayers WebGLTileLayers while retaining previous timestamps during tile loads.
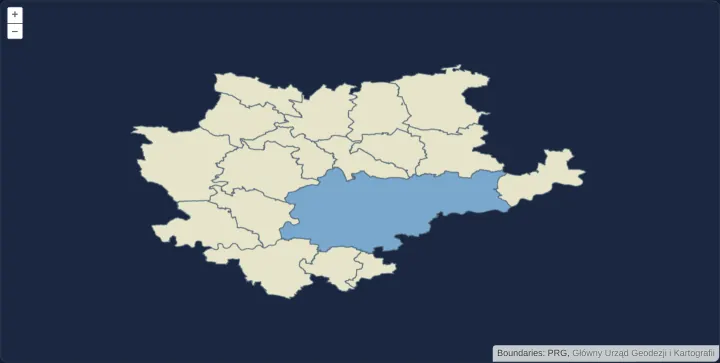
Municipality vector tiles drawn with WebGL
Render local WorldCRS84Quad municipality Mapbox Vector Tiles on the GPU in OpenLayers using WebGLVectorTileLayer and flat case expressions.
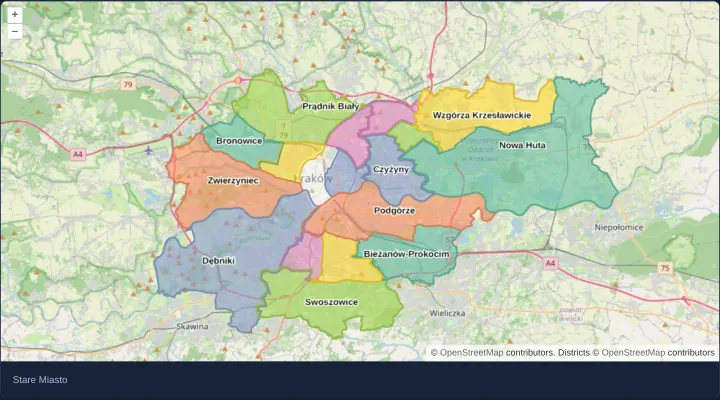
Polygons in a WebGL vector layer
Render Kraków’s 18 districts on the GPU with an OpenLayers WebGLVectorLayer and highlight hovered polygons via style variables without rebuilds.
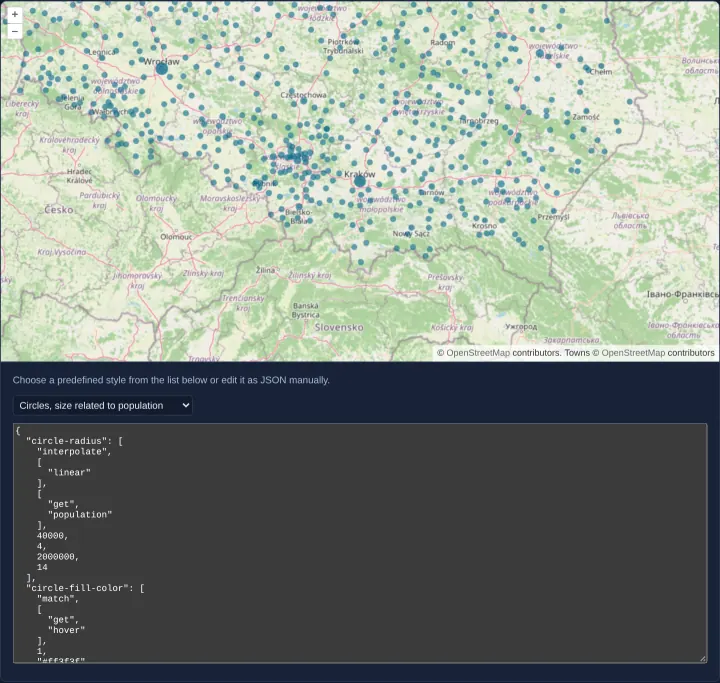
Point styles edited as JSON
Render 1,027 Polish towns on the GPU in OpenLayers and edit live JSON flat point styles—circles, icons and time-animated bars—with hover state.
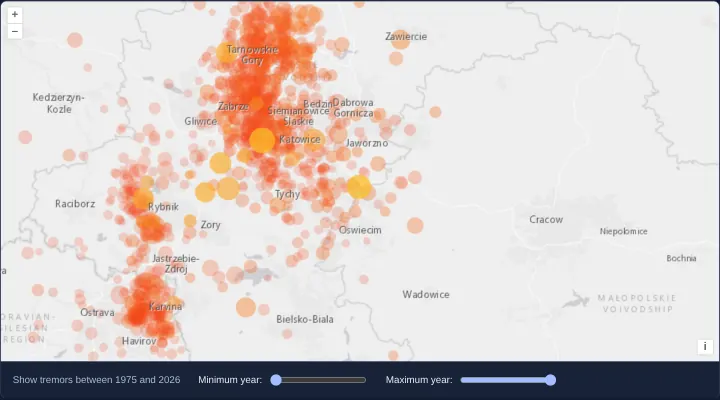
Tremors filtered by year on the GPU
Filter 1,130 pulsing seismic points by year range live on the GPU in OpenLayers using WebGL style variables and between filter expressions.
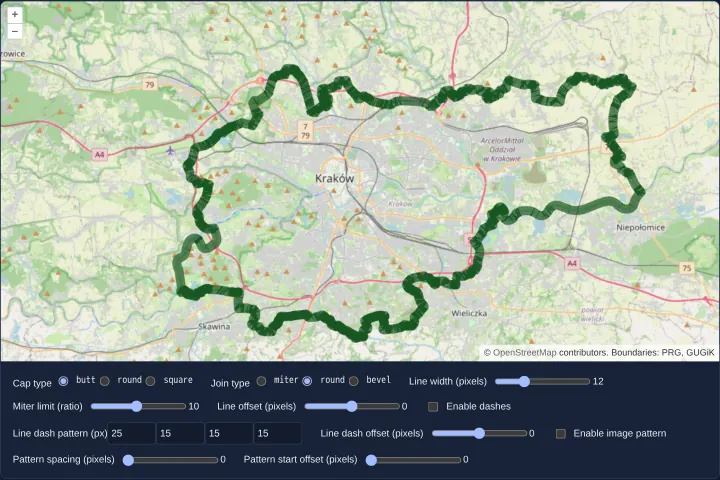
Line styles drawn with WebGL
Draw and edit wide, dashed, offset and pattern-textured lines on the GPU in OpenLayers WebGLVectorLayer using live stroke style variables.
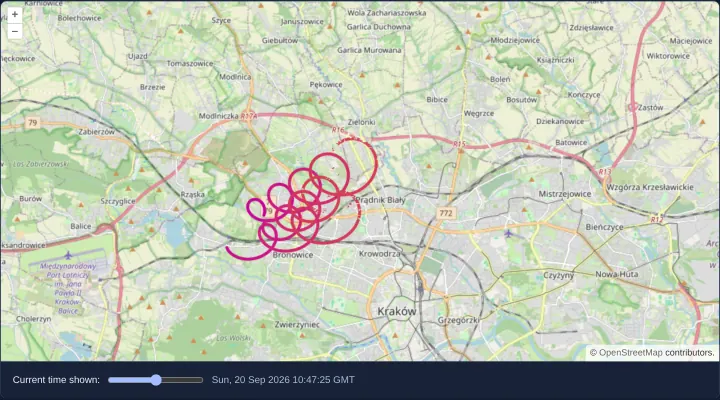
Flight tracks shown up to a time
Trim and colour IGC glider flight tracks dynamically by time on the GPU in OpenLayers WebGLVectorLayer using interpolated line-metric M values.
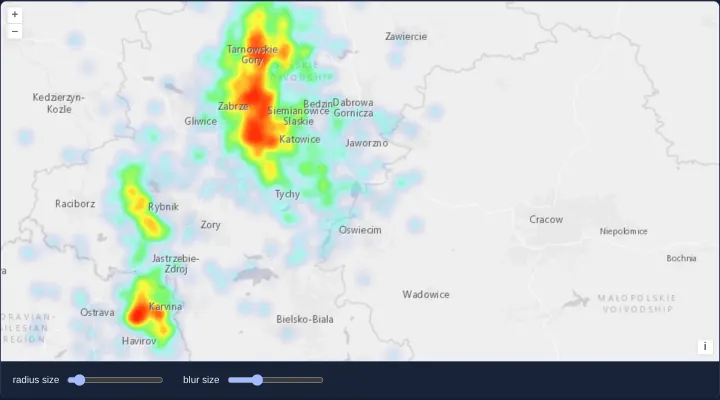
A heatmap of tremors from KML
Render 1,130 KML seismic events across Upper Silesia and Kraków as a magnitude-weighted OpenLayers Heatmap layer with radius and blur sliders.
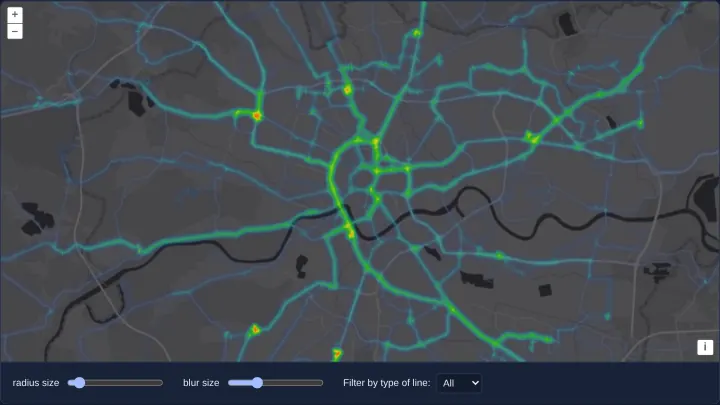
A heatmap of transit routes
Visualize 371 Kraków tram and bus LineString routes as a corridor-density OpenLayers Heatmap filtered dynamically by vehicle type variables.
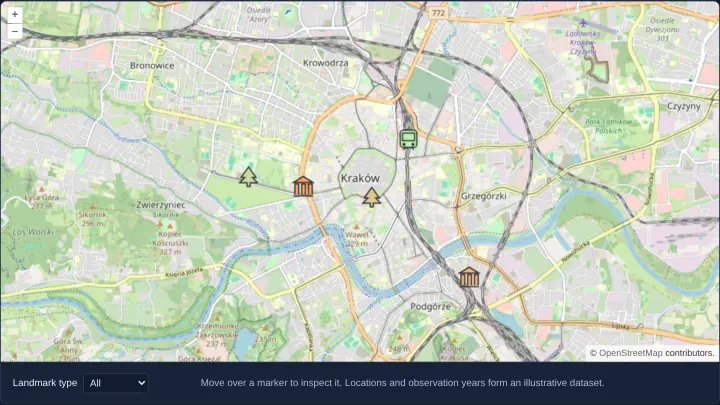
Filter a WebGL icon atlas
Render Kraków landmarks from a single SVG sprite atlas in OpenLayers WebGLVectorLayer with live category filtering and observation-year tinting.
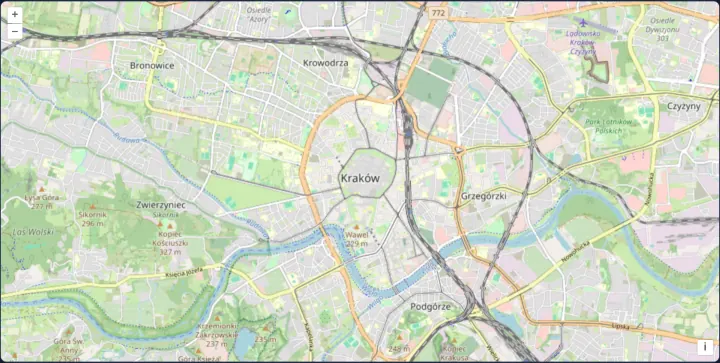
Render map tiles in a worker
Render OpenStreetMap tiles inside a dedicated Web Worker OffscreenCanvas in OpenLayers and transfer ImageBitmaps to keep UI threads responsive.
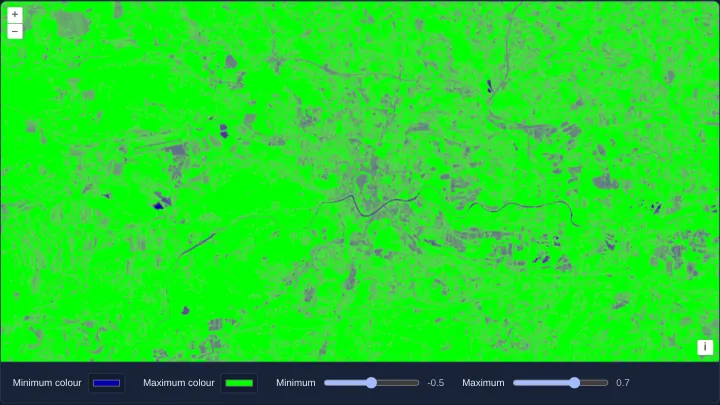
Colour a raster index
Build dynamic chroma-js colour ramps for Sentinel-2 Cloud Optimized GeoTIFF band indices in OpenLayers with live min, max and colour pickers.
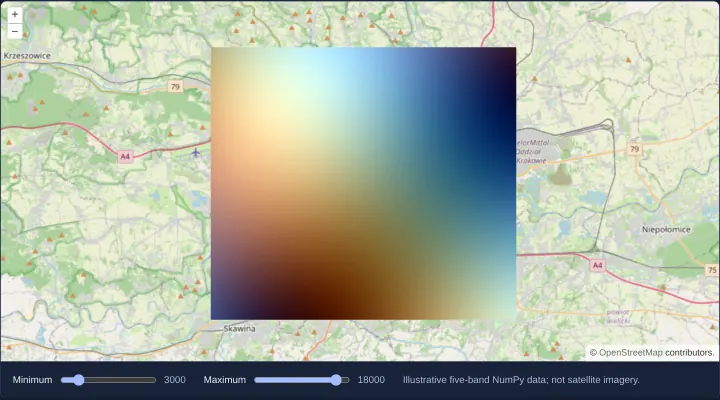
Read five-band NumPy tiles
Decode planar multi-band scientific NumPy .npy rasters into 5-band OpenLayers DataTiles using @planet/ol-numpytiles and WebGL range styling.
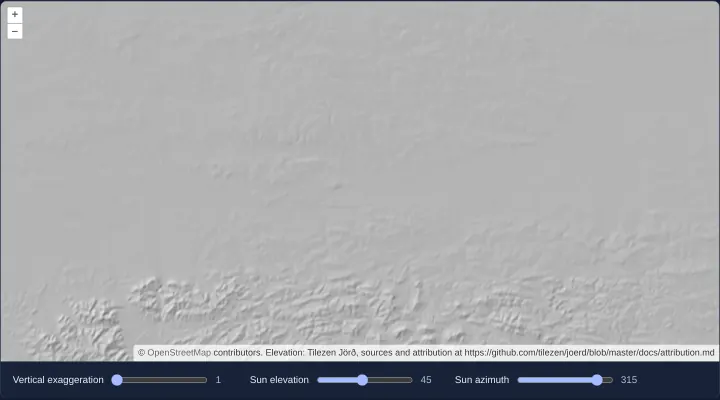
Shade terrain from a PMTiles archive
Decode Terrarium RGB elevation tiles from a serverless PMTiles archive in OpenLayers and adjust interactive GPU hillshade lighting in WebGL.
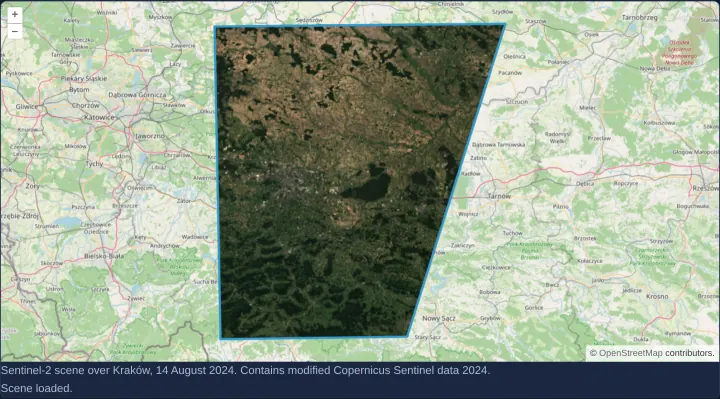
Display a Sentinel-2 STAC item
Open and display a Copernicus Sentinel-2 SpatioTemporal Asset Catalog (STAC) item over Kraków in OpenLayers using ol-stac and proj4 support.
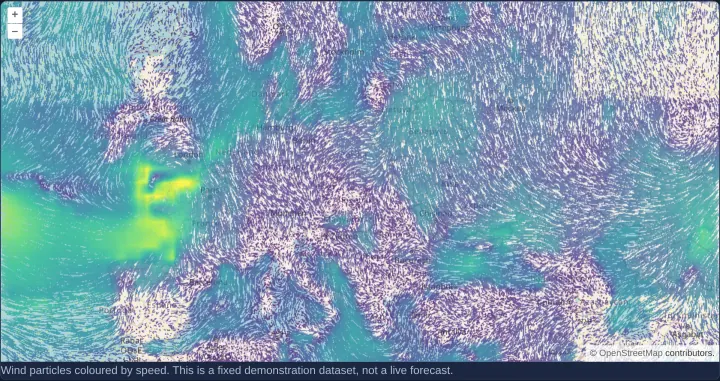
Animate a wind vector field
Animate speed-coloured wind streamlines and moving particles on the GPU in OpenLayers using the experimental WebGL Flow layer and DataTiles.
Projections
22 examplesGeographic coordinates, raster and vector reprojection with proj4, custom projections and their scale.
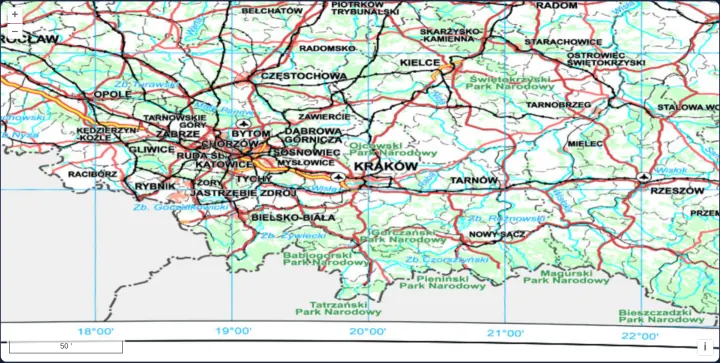
A map in EPSG:4326
Configure a native geographic EPSG:4326 OpenLayers map view over southern Poland with WMS 1.3.0 JPEG tiles and an arc-degree ScaleLine control.
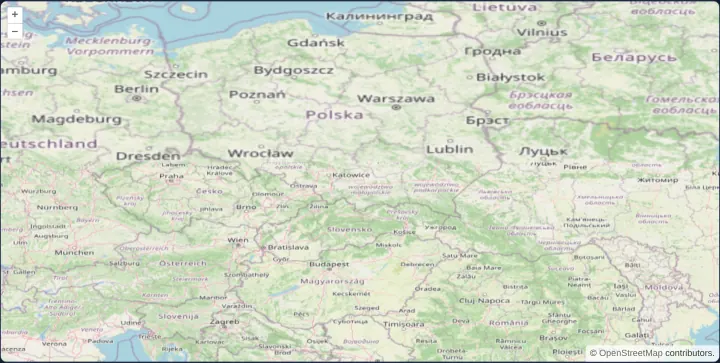
OpenStreetMap reprojected to WGS 84
Reproject Web Mercator OpenStreetMap raster tiles into an EPSG:4326 geographic view in the browser using OpenLayers adaptive triangulation.
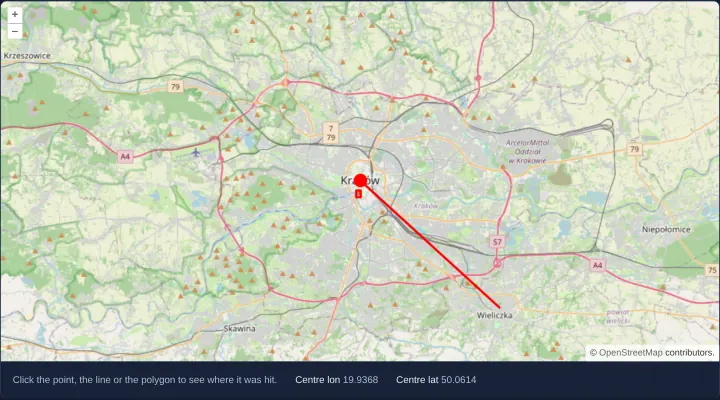
Longitude and latitude as map coordinates
Work in WGS84 longitude and latitude across view center, clicks and vector features on a Web Mercator map using OpenLayers useGeographic().
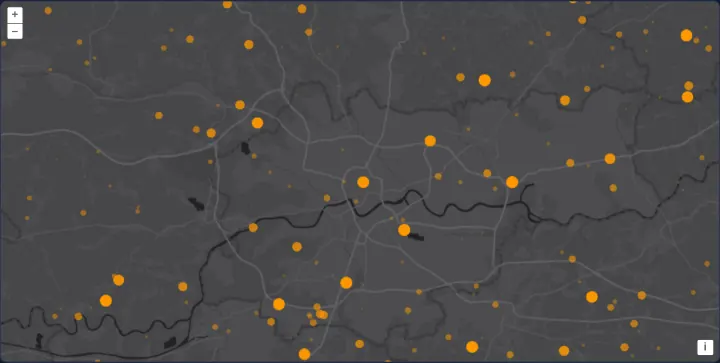
Immediate rendering in geographic coordinates
Draw 1,000 age-faded orange points in WGS84 degrees on every animation frame in OpenLayers using getVectorContext() and useGeographic().
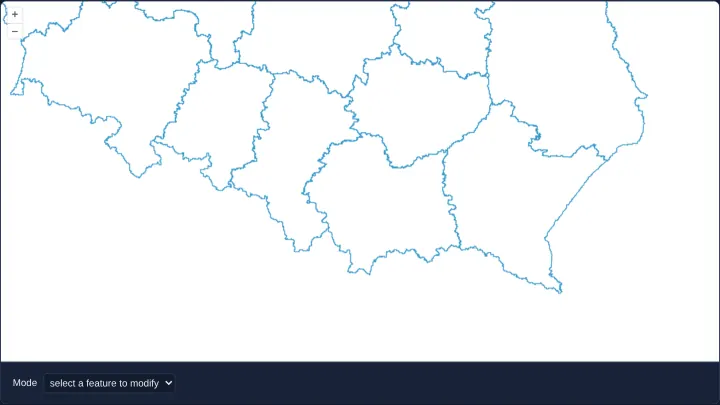
Editing in geographic coordinates
Modify Polish voivodeship polygons and draw snapped shapes directly in WGS84 degrees on a Web Mercator map using OpenLayers useGeographic().
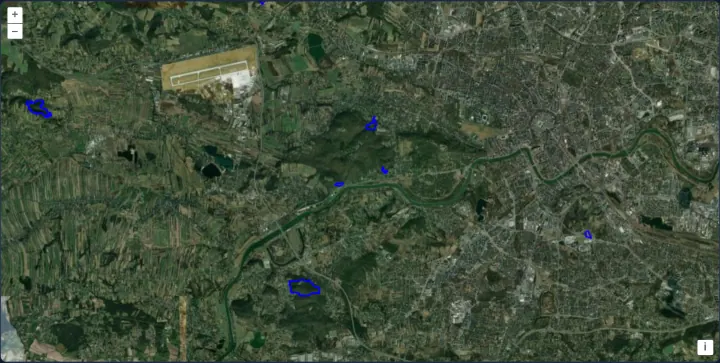
A WFS in geographic coordinates
Load GDOŚ nature reserves tile by tile as WGS84 GeoJSON from an OGC WFS in OpenLayers using useGeographic() and a 512px XYZ tile strategy.
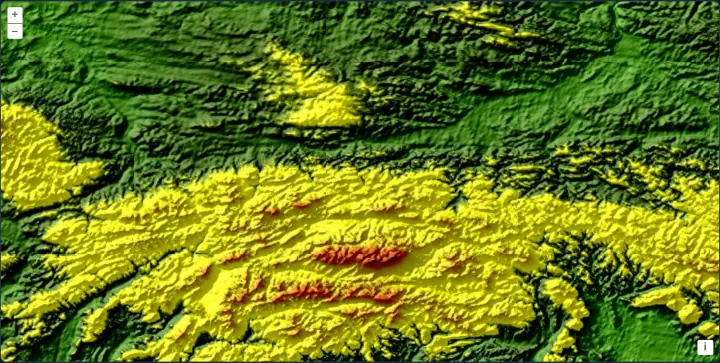
OGC API map tiles in WorldCRS84Quad
Display GTOPO30 Carpathian shaded relief from OGC API - Tiles using the geographic WorldCRS84Quad matrix set in an EPSG:4326 OpenLayers view.
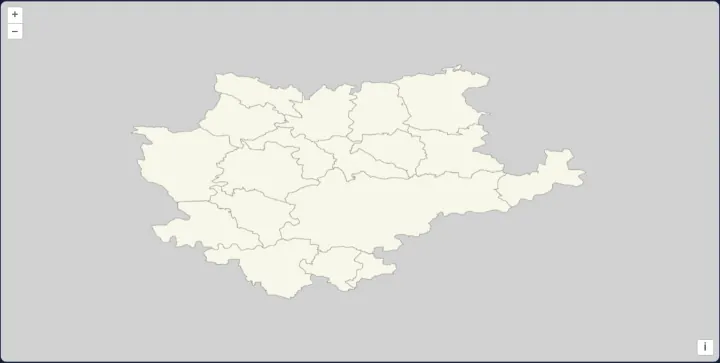
OGC API vector tiles in WorldCRS84Quad
Serve static serverless Mapbox Vector Tiles in OGC WorldCRS84Quad geographic coordinates to an EPSG:4326 OpenLayers map using absolute URLs.
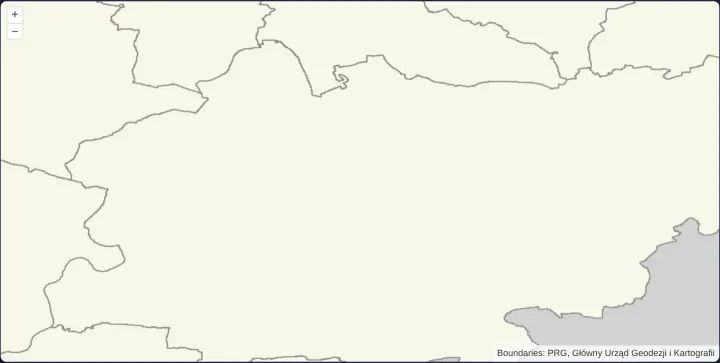
A 512-pixel geographic vector-tile grid
Configure an explicit 512-pixel EPSG:4326 vector-tile grid in OpenLayers and apply a local Mapbox GL v8 style with matching zoom resolutions.
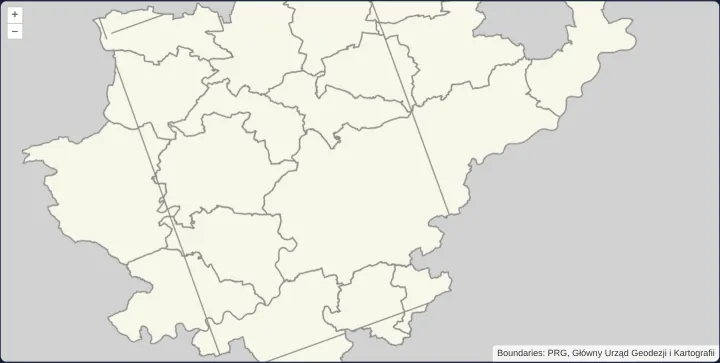
Geographic vector tiles in a polar equal-area view
Reproject EPSG:4326 geographic vector tiles on the fly into a polar Lambert Azimuthal Equal Area (ESRI:102017) OpenLayers view with proj4.
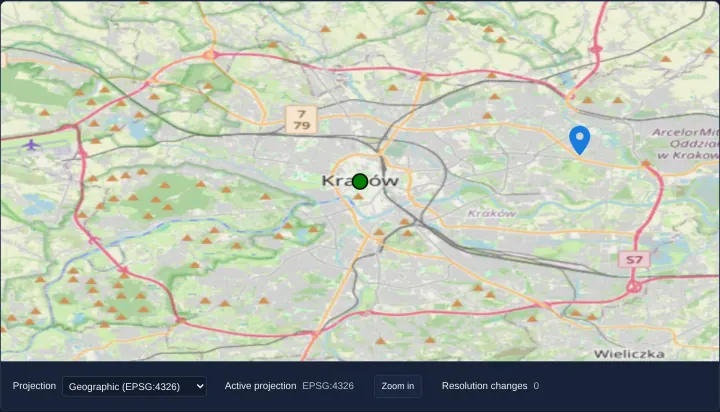
Switch the view projection
Switch an OpenLayers map View dynamically between EPSG:3857 Web Mercator and EPSG:4326 geographic degrees using signals and resolution events.
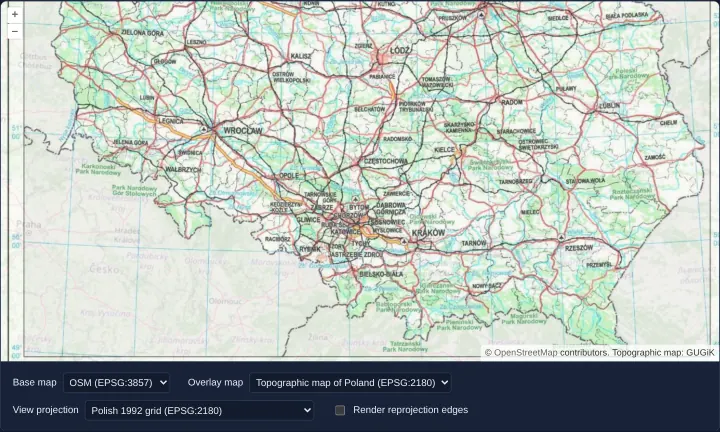
Raster reprojection between eight projections
Reproject OpenStreetMap, Polish EPSG:2180 WMTS, Arctic polar maps and NASA WGS84 relief across eight view projections with triangle debug edges.
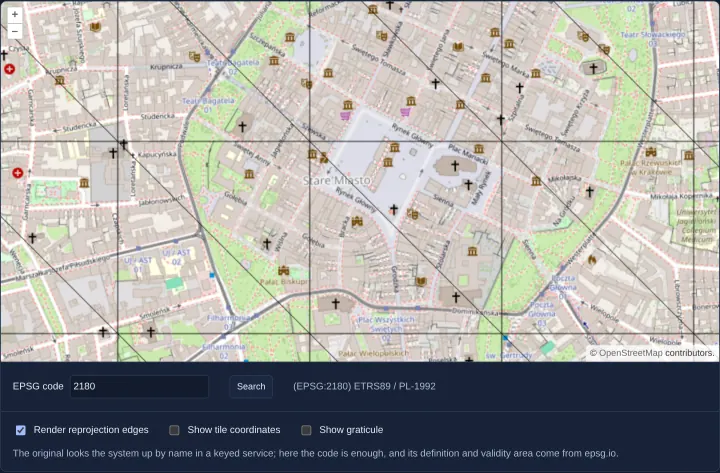
Reprojection to an EPSG code looked up online
Look up any EPSG code live from epsg.io, register its proj4 definition and area-of-use extent, and reproject OpenStreetMap in the browser.
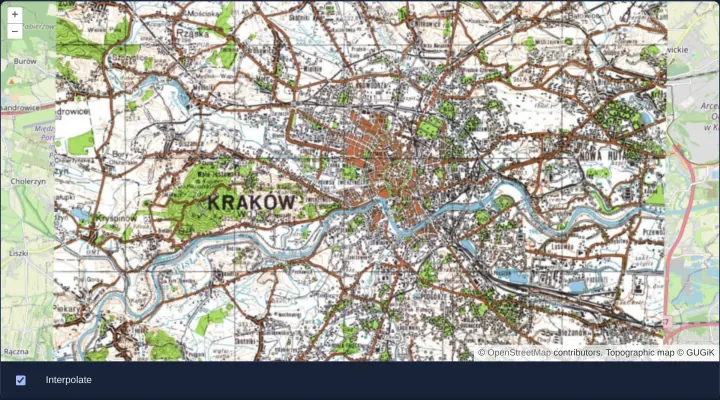
A single image reprojected
Reproject a static 1000x800 EPSG:2180 topographic image onto a Web Mercator OpenLayers map and toggle bilinear vs nearest-pixel interpolation.
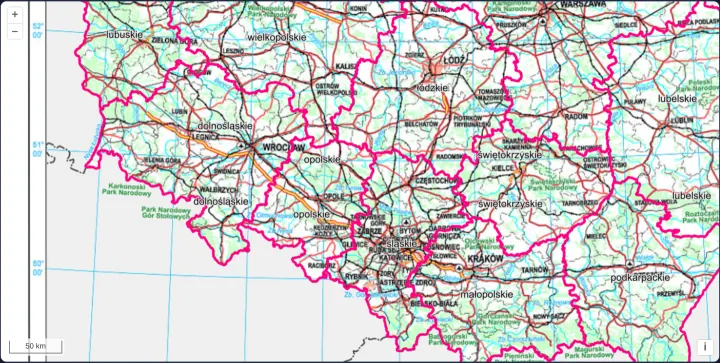
A tiled WMS in the Polish 1992 grid
Run a native Polish 1992 grid (EPSG:2180) OpenLayers View with proj4, tiled GUGiK WMS 1.1.1 layers and MapServer HiDPI boundary scaling.
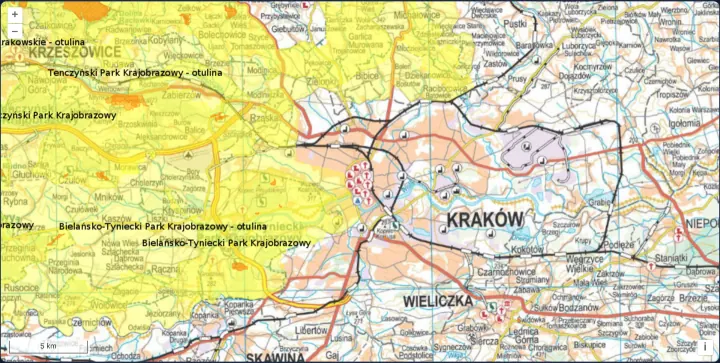
A single image WMS in the Polish 1992 grid
Request single-image WMS 1.3.0 maps in Polish 1992 grid (EPSG:2180) using OpenLayers Projection axisOrientation neu and GeoServer HiDPI DPI.
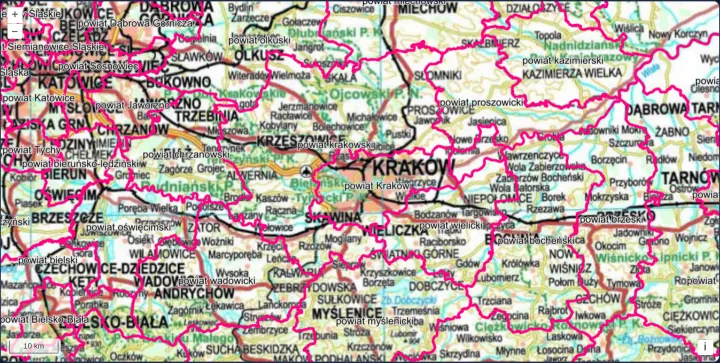
A WMS in a projection known only by its code
Display GUGiK EPSG:2180 WMS layers and a metric scale line in OpenLayers without loading proj4 by declaring a code-and-units Projection only.
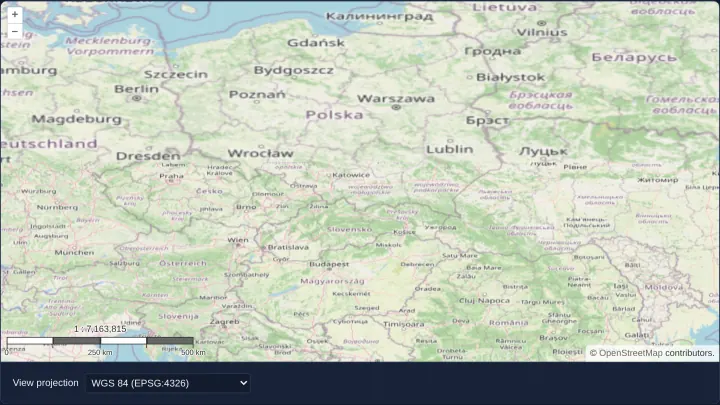
Keep the scale when the projection changes
Preserve true ground scale at the map centre when switching OpenLayers views between WGS84 and Web Mercator using getPointResolution ratios.
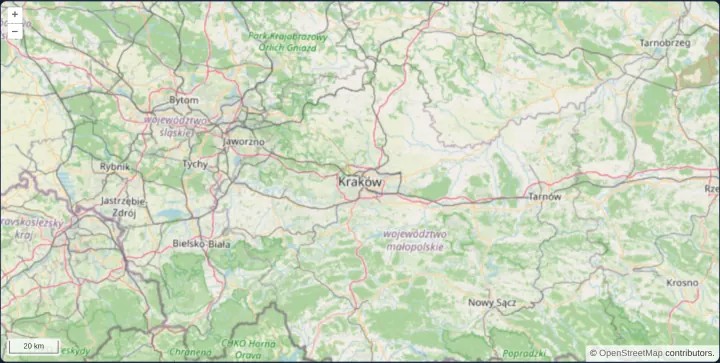
A scale line in the Polish 2000 grid
Reproject OpenStreetMap into Polish 2000 zone 7 (EPSG:2178) around Kraków with proj4, national extent bounds and a spherical metric ScaleLine.
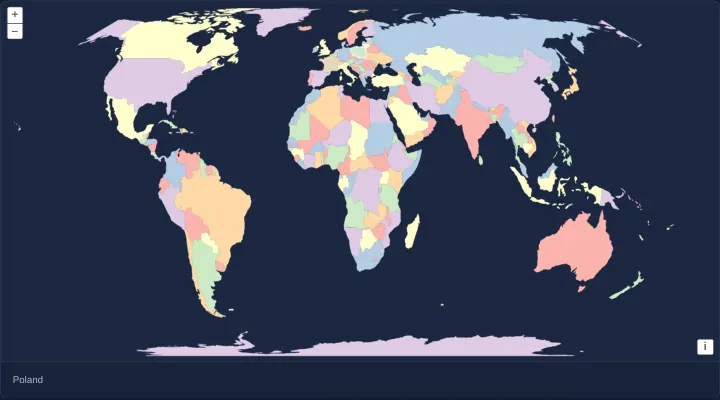
Equal Earth with a moving central meridian
Render world countries in a dynamic Equal Earth projection whose central meridian follows horizontal panning in 5-degree steps with antimeridian cuts.
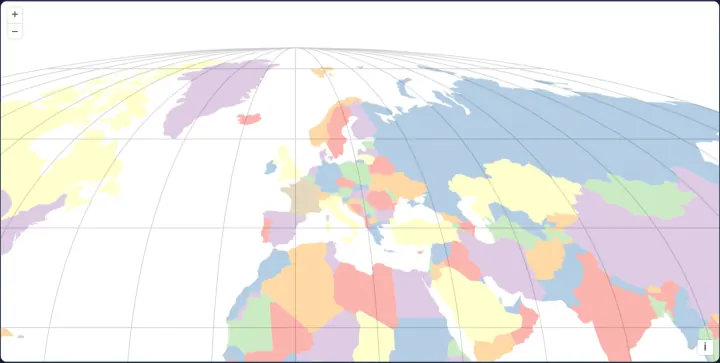
The world in Sphere Mollweide
Display world countries and a curved meridian graticule in the equal-area Sphere Mollweide projection (ESRI:53009) using proj4 in OpenLayers.
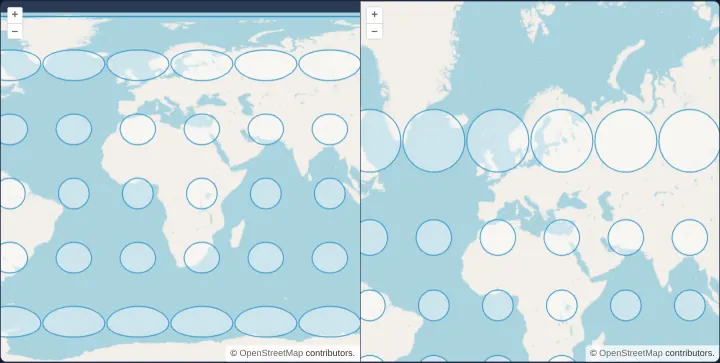
Tissot's indicatrices in two projections
Compare angular and area map distortion side by side between EPSG:4326 and Web Mercator in OpenLayers using 84 spherical Tissot indicatrices.
Printing and export
3 examplesMap images with georeferencing, PDF pages at a chosen size and resolution, and maps printed at a chosen scale with a scale bar and attributions.
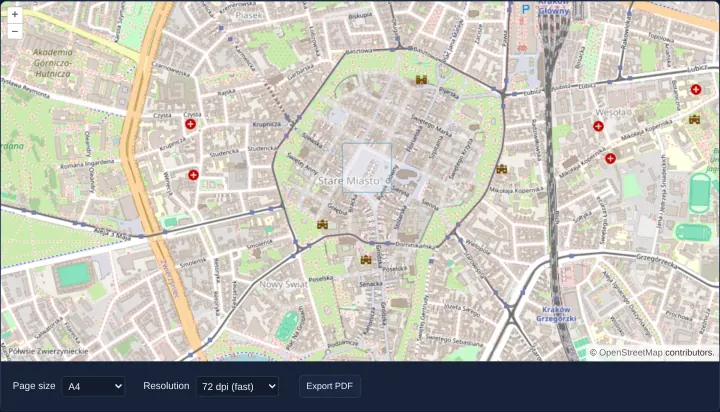
Export the map as a PDF
Export the visible OpenLayers map extent to a single-page A5–A0 PDF up to 300 DPI off-screen using cc-openlayers MapRenderer and symbolScale.
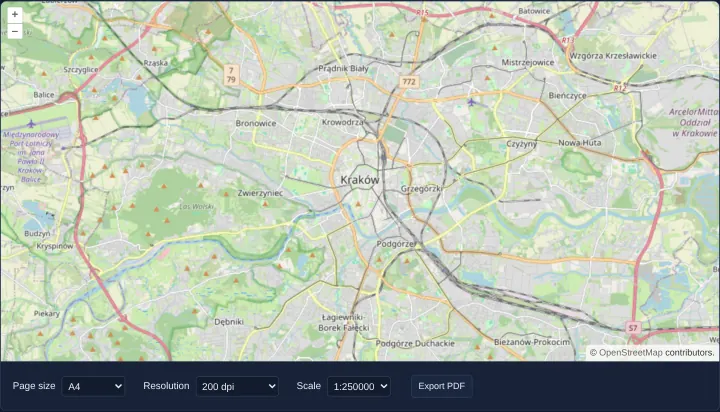
Print the map at a chosen scale
Print an OpenLayers map of Kraków to a true cartographic scale PDF (1:10,000 to 1:500,000) using getPointResolution, scale bar and credits.
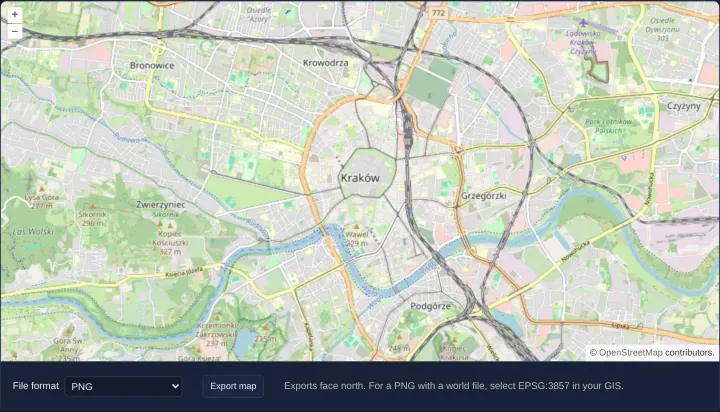
Export a georeferenced map image
Export a north-up OpenLayers map of Kraków as a plain PNG, a ZIP archive with an ESRI world file, or a georeferenced RGBA GeoTIFF in Angular.