Raster, GeoTIFF and WebGL · Angular, React and OpenLayers
Shaded relief computed on the CPU
Compute interactive hillshade relief over Ojców’s Prądnik gorge on the CPU from Terrarium DEM tiles using an OpenLayers image RasterSource UI.
What this example shows
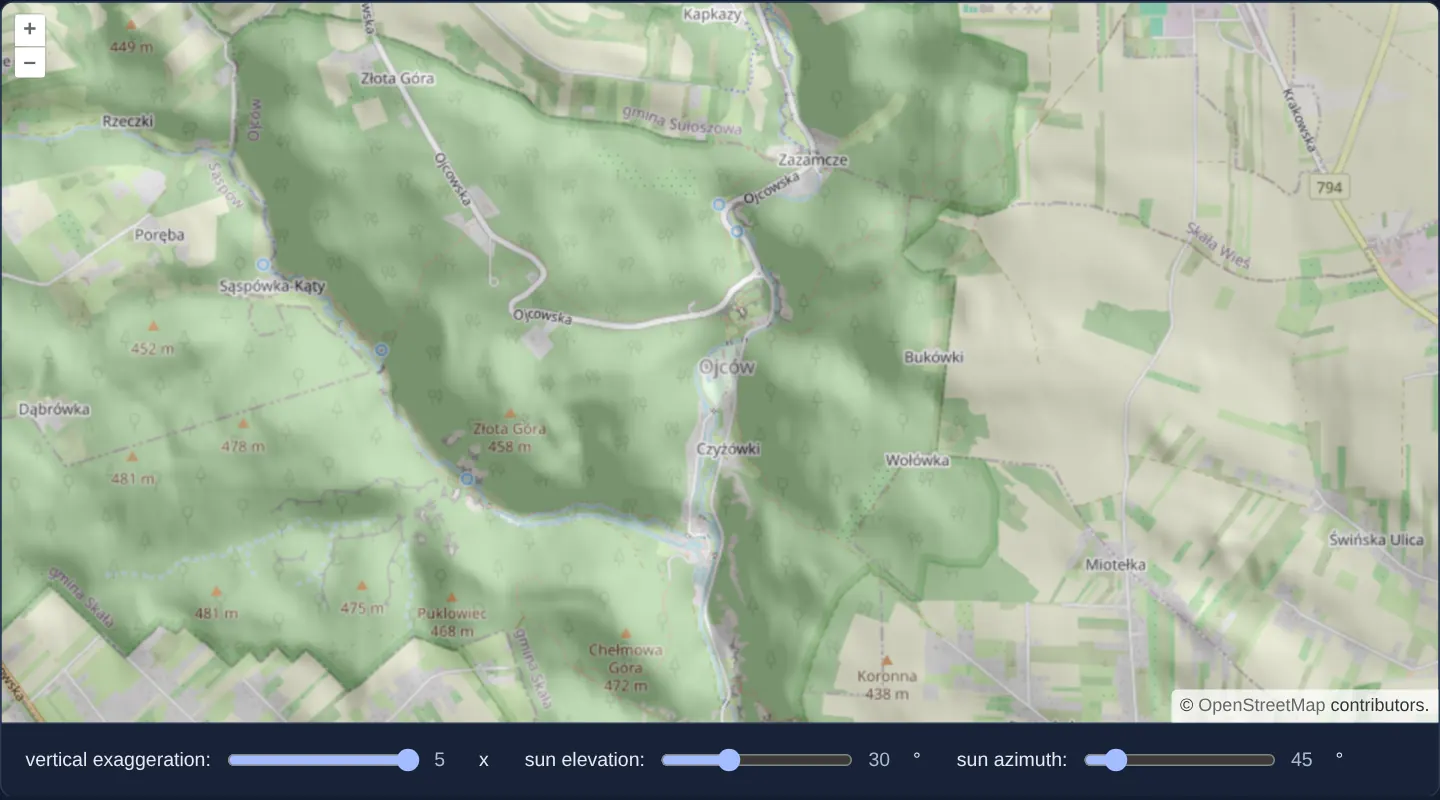
Zoomed to level 14 over Ojców National Park north of Kraków, dynamic shaded relief draped at 30% opacity ([opacity]="0.3") over OpenStreetMap brings the steep limestone cliffs of the Prądnik gorge and tributary ravines into crisp 3D focus, controlled live by sliders for vertical exaggeration, sun elevation and sun azimuth.
When you need it
Geomorphologists, trail designers, archaeologists and forestry planners adjust virtual sun azimuth and elevation interactively to reveal subtle ridges, quarries or fault scarps that fixed north-west hillshades hide.
Computing analytical hillshade from raw elevation tiles in the browser replaces static pre-rendered hillshade WMS layers with a fully steerable light source.
The code
The example uses cc-openlayers, my Angular component library for OpenLayers: each aol-… element creates the OpenLayers object it names, updates it from its inputs and disposes of it with the component.
shaded-relief.shared.ts/**
* Generates a shaded relief image given elevation data. Uses a 3x3
* neighborhood for determining slope and aspect.
* @param inputs Array of input images.
* @param data Data added in the "beforeoperations" event.
* @return Output image.
*/
export function shade(inputs: (number[] | ImageData)[], data: object): ImageData {
const { resolution, vert, sunEl: elevation, sunAz: azimuth } = data as Record<string, number>;
const elevationImage = inputs[0] as ImageData;
const width = elevationImage.width;
const height = elevationImage.height;
const elevationData = elevationImage.data;
const shadeData = new Uint8ClampedArray(elevationData.length);
const dp = resolution * 2;
const maxX = width - 1;
const maxY = height - 1;
const pixel = [0, 0, 0, 0];
const twoPi = 2 * Math.PI;
const halfPi = Math.PI / 2;
const sunEl = (Math.PI * elevation) / 180;
const sunAz = (Math.PI * azimuth) / 180;
const cosSunEl = Math.cos(sunEl);
const sinSunEl = Math.sin(sunEl);
let pixelX, pixelY, x0, x1, y0, y1, offset, z0, z1, dzdx, dzdy, slope, aspect, cosIncidence, scaled;
function calculateElevation(pixel: number[]) {
// The method used to extract elevations from the DEM.
// In this case the format used is Terrarium
// red * 256 + green + blue / 256 - 32768
//
// Other frequently used methods include the Mapbox format
// (red * 256 * 256 + green * 256 + blue) * 0.1 - 10000
//
return pixel[0] * 256 + pixel[1] + pixel[2] / 256 - 32768;
}
for (pixelY = 0; pixelY <= maxY; ++pixelY) {
y0 = pixelY === 0 ? 0 : pixelY - 1;
y1 = pixelY === maxY ? maxY : pixelY + 1;
for (pixelX = 0; pixelX <= maxX; ++pixelX) {
x0 = pixelX === 0 ? 0 : pixelX - 1;
x1 = pixelX === maxX ? maxX : pixelX + 1;
// determine elevation for (x0, pixelY)
offset = (pixelY * width + x0) * 4;
pixel[0] = elevationData[offset];
pixel[1] = elevationData[offset + 1];
pixel[2] = elevationData[offset + 2];
pixel[3] = elevationData[offset + 3];
z0 = vert * calculateElevation(pixel);
// determine elevation for (x1, pixelY)
offset = (pixelY * width + x1) * 4;
pixel[0] = elevationData[offset];
pixel[1] = elevationData[offset + 1];
pixel[2] = elevationData[offset + 2];
pixel[3] = elevationData[offset + 3];
z1 = vert * calculateElevation(pixel);
dzdx = (z1 - z0) / dp;
// determine elevation for (pixelX, y0)
offset = (y0 * width + pixelX) * 4;
pixel[0] = elevationData[offset];
pixel[1] = elevationData[offset + 1];
pixel[2] = elevationData[offset + 2];
pixel[3] = elevationData[offset + 3];
z0 = vert * calculateElevation(pixel);
// determine elevation for (pixelX, y1)
offset = (y1 * width + pixelX) * 4;
pixel[0] = elevationData[offset];
pixel[1] = elevationData[offset + 1];
pixel[2] = elevationData[offset + 2];
pixel[3] = elevationData[offset + 3];
z1 = vert * calculateElevation(pixel);
dzdy = (z1 - z0) / dp;
slope = Math.atan(Math.sqrt(dzdx * dzdx + dzdy * dzdy));
aspect = Math.atan2(dzdy, -dzdx);
if (aspect < 0) {
aspect = halfPi - aspect;
} else if (aspect > halfPi) {
aspect = twoPi - aspect + halfPi;
} else {
aspect = halfPi - aspect;
}
cosIncidence = sinSunEl * Math.cos(slope) + cosSunEl * Math.sin(slope) * Math.cos(sunAz - aspect);
offset = (pixelY * width + pixelX) * 4;
scaled = 255 * cosIncidence;
shadeData[offset] = scaled;
shadeData[offset + 1] = scaled;
shadeData[offset + 2] = scaled;
shadeData[offset + 3] = elevationData[offset + 3];
}
}
return {
data: shadeData,
width,
height,
colorSpace: 'srgb',
} as ImageData;
}
/** A range control: its name, label, range and start, and the unit its value is shown in. */
export interface Control {
name: 'vert' | 'sunEl' | 'sunAz';
label: string;
min: number;
max: number;
start: number;
unit: string;
}
export const CONTROLS: Control[] = [
{ name: 'vert', label: 'vertical exaggeration:', min: 1, max: 5, start: 1, unit: 'x' },
{ name: 'sunEl', label: 'sun elevation:', min: 0, max: 90, start: 45, unit: '°' },
{ name: 'sunAz', label: 'sun azimuth:', min: 0, max: 360, start: 45, unit: '°' },
];
export const ATTRIBUTIONS =
'Elevation: <a href="https://github.com/tilezen/joerd/blob/master/docs/attribution.md" target="_blank">Terrain Tiles</a>';shaded-relief.tsimport { ChangeDetectionStrategy, Component, signal, viewChild } from '@angular/core';
import type { RasterSourceEvent } from 'ol/source/Raster';
import {
CoordinateComponent,
DefaultControlComponent,
DefaultInteractionComponent,
LayerImageComponent,
LayerTileComponent,
MapComponent,
SourceImageTileComponent,
SourceOsmComponent,
SourceRasterComponent,
ViewComponent,
} from 'cc-openlayers';
import { ATTRIBUTIONS, CONTROLS, type Control, shade } from './shaded-relief.shared';
/**
* A shaded relief computed on the CPU by a raster source from Terrarium elevation tiles: the gorge of the Prądnik at
* Ojców, north of Kraków, with its limestone rocks, laid over OpenStreetMap. The sliders set the vertical
* exaggeration and the sun's elevation and azimuth, which the source passes to its operation before each frame.
*/
@Component({
selector: 'app-shaded-relief',
imports: [
CoordinateComponent,
DefaultControlComponent,
DefaultInteractionComponent,
LayerImageComponent,
LayerTileComponent,
MapComponent,
SourceImageTileComponent,
SourceOsmComponent,
SourceRasterComponent,
ViewComponent,
],
changeDetection: ChangeDetectionStrategy.OnPush,
template: `
<aol-map height="480px">
<aol-interaction-default />
<aol-control-defaults />
<aol-view [zoom]="14">
<aol-coordinate [x]="19.8291" [y]="50.2097" srid="EPSG:4326" />
</aol-view>
<aol-layer-tile><aol-source-osm /></aol-layer-tile>
<aol-layer-image [opacity]="0.3">
<aol-source-raster operationType="image" [operation]="operation" (beforeOperations)="beforeOperations($event)">
<aol-source-imagetile
url="https://s3.amazonaws.com/elevation-tiles-prod/terrarium/{z}/{x}/{y}.png"
[maxZoom]="15"
[attributions]="attributions"
/>
</aol-source-raster>
</aol-layer-image>
</aol-map>
<div class="example-controls">
@for (control of controls; track control.name) {
<label>
{{ control.label }}
<input
type="range"
[name]="control.name"
[min]="control.min"
[max]="control.max"
[value]="values()[control.name]"
(input)="set(control.name, $event)"
/>
<output>{{ values()[control.name] }}</output>
{{ control.unit }}
</label>
}
</div>
`,
})
export class ShadedRelief {
protected readonly attributions = ATTRIBUTIONS;
protected readonly operation = shade;
protected readonly controls = CONTROLS;
protected readonly values = signal(Object.fromEntries(CONTROLS.map((control) => [control.name, control.start])));
private readonly raster = viewChild.required(SourceRasterComponent);
protected set(name: Control['name'], event: Event): void {
const value = Number((event.target as HTMLInputElement).value);
this.values.update((values) => ({ ...values, [name]: value }));
this.raster().instance.changed();
}
/** The event's data object is passed to the operation. */
protected beforeOperations(event: RasterSourceEvent): void {
const data = event.data;
data.resolution = event.resolution;
for (const [name, value] of Object.entries(this.values())) {
data[name] = value;
}
}
} The React version uses the library's React adapter, cc-openlayers/react: each component creates the OpenLayers object it names when it mounts, updates it from its props and disposes of it when it unmounts.
shaded-relief.react.tsximport { useRef, useState, type ChangeEvent } from 'react';
import type Raster from 'ol/source/Raster.js';
import type { Operation, RasterSourceEvent } from 'ol/source/Raster.js';
import {
Coordinate,
DefaultControls,
DefaultInteractions,
ImageLayer,
ImageTileSource,
Map,
OSMSource,
RasterSource,
TileLayer,
View,
} from 'cc-openlayers/react';
import { ATTRIBUTIONS, CONTROLS, type Control, shade } from './shaded-relief.shared';
/**
* A shaded relief computed on the CPU by a raster source from Terrarium elevation tiles: the gorge of the Prądnik at
* Ojców, north of Kraków, with its limestone rocks, laid over OpenStreetMap. The sliders set the vertical
* exaggeration and the sun's elevation and azimuth, which the source passes to its operation before each frame.
*/
export function ShadedRelief() {
const [values, setValues] = useState<Record<string, number>>(
Object.fromEntries(CONTROLS.map((control) => [control.name, control.start]))
);
const raster = useRef<Raster>(null);
const set = (name: Control['name'], event: ChangeEvent<HTMLInputElement>) => {
const value = Number(event.target.value);
setValues((current) => ({ ...current, [name]: value }));
raster.current?.changed();
};
/** The event's data object is passed to the operation. */
const beforeOperations = (event: RasterSourceEvent): void => {
const data = event.data;
data.resolution = event.resolution;
for (const [name, value] of Object.entries(values)) {
data[name] = value;
}
};
return (
<>
<Map height="480px">
<DefaultInteractions />
<DefaultControls />
<View zoom={14}>
<Coordinate x={19.8291} y={50.2097} srid="EPSG:4326" />
</View>
<TileLayer>
<OSMSource />
</TileLayer>
<ImageLayer opacity={0.3}>
<RasterSource
ref={raster}
operationType="image"
operation={shade as Operation}
onBeforeOperations={beforeOperations}
>
<ImageTileSource
url="https://s3.amazonaws.com/elevation-tiles-prod/terrarium/{z}/{x}/{y}.png"
maxZoom={15}
attributions={ATTRIBUTIONS}
/>
</RasterSource>
</ImageLayer>
</Map>
<div className="example-controls">
{CONTROLS.map((control) => (
<label key={control.name}>
{control.label}
<input
type="range"
name={control.name}
min={control.min}
max={control.max}
value={values[control.name]}
onChange={(event) => set(control.name, event)}
/>
<output>{values[control.name]}</output>
{control.unit}
</label>
))}
</div>
</>
);
}shaded-relief.shared.ts/**
* Generates a shaded relief image given elevation data. Uses a 3x3
* neighborhood for determining slope and aspect.
* @param inputs Array of input images.
* @param data Data added in the "beforeoperations" event.
* @return Output image.
*/
export function shade(inputs: (number[] | ImageData)[], data: object): ImageData {
const { resolution, vert, sunEl: elevation, sunAz: azimuth } = data as Record<string, number>;
const elevationImage = inputs[0] as ImageData;
const width = elevationImage.width;
const height = elevationImage.height;
const elevationData = elevationImage.data;
const shadeData = new Uint8ClampedArray(elevationData.length);
const dp = resolution * 2;
const maxX = width - 1;
const maxY = height - 1;
const pixel = [0, 0, 0, 0];
const twoPi = 2 * Math.PI;
const halfPi = Math.PI / 2;
const sunEl = (Math.PI * elevation) / 180;
const sunAz = (Math.PI * azimuth) / 180;
const cosSunEl = Math.cos(sunEl);
const sinSunEl = Math.sin(sunEl);
let pixelX, pixelY, x0, x1, y0, y1, offset, z0, z1, dzdx, dzdy, slope, aspect, cosIncidence, scaled;
function calculateElevation(pixel: number[]) {
// The method used to extract elevations from the DEM.
// In this case the format used is Terrarium
// red * 256 + green + blue / 256 - 32768
//
// Other frequently used methods include the Mapbox format
// (red * 256 * 256 + green * 256 + blue) * 0.1 - 10000
//
return pixel[0] * 256 + pixel[1] + pixel[2] / 256 - 32768;
}
for (pixelY = 0; pixelY <= maxY; ++pixelY) {
y0 = pixelY === 0 ? 0 : pixelY - 1;
y1 = pixelY === maxY ? maxY : pixelY + 1;
for (pixelX = 0; pixelX <= maxX; ++pixelX) {
x0 = pixelX === 0 ? 0 : pixelX - 1;
x1 = pixelX === maxX ? maxX : pixelX + 1;
// determine elevation for (x0, pixelY)
offset = (pixelY * width + x0) * 4;
pixel[0] = elevationData[offset];
pixel[1] = elevationData[offset + 1];
pixel[2] = elevationData[offset + 2];
pixel[3] = elevationData[offset + 3];
z0 = vert * calculateElevation(pixel);
// determine elevation for (x1, pixelY)
offset = (pixelY * width + x1) * 4;
pixel[0] = elevationData[offset];
pixel[1] = elevationData[offset + 1];
pixel[2] = elevationData[offset + 2];
pixel[3] = elevationData[offset + 3];
z1 = vert * calculateElevation(pixel);
dzdx = (z1 - z0) / dp;
// determine elevation for (pixelX, y0)
offset = (y0 * width + pixelX) * 4;
pixel[0] = elevationData[offset];
pixel[1] = elevationData[offset + 1];
pixel[2] = elevationData[offset + 2];
pixel[3] = elevationData[offset + 3];
z0 = vert * calculateElevation(pixel);
// determine elevation for (pixelX, y1)
offset = (y1 * width + pixelX) * 4;
pixel[0] = elevationData[offset];
pixel[1] = elevationData[offset + 1];
pixel[2] = elevationData[offset + 2];
pixel[3] = elevationData[offset + 3];
z1 = vert * calculateElevation(pixel);
dzdy = (z1 - z0) / dp;
slope = Math.atan(Math.sqrt(dzdx * dzdx + dzdy * dzdy));
aspect = Math.atan2(dzdy, -dzdx);
if (aspect < 0) {
aspect = halfPi - aspect;
} else if (aspect > halfPi) {
aspect = twoPi - aspect + halfPi;
} else {
aspect = halfPi - aspect;
}
cosIncidence = sinSunEl * Math.cos(slope) + cosSunEl * Math.sin(slope) * Math.cos(sunAz - aspect);
offset = (pixelY * width + pixelX) * 4;
scaled = 255 * cosIncidence;
shadeData[offset] = scaled;
shadeData[offset + 1] = scaled;
shadeData[offset + 2] = scaled;
shadeData[offset + 3] = elevationData[offset + 3];
}
}
return {
data: shadeData,
width,
height,
colorSpace: 'srgb',
} as ImageData;
}
/** A range control: its name, label, range and start, and the unit its value is shown in. */
export interface Control {
name: 'vert' | 'sunEl' | 'sunAz';
label: string;
min: number;
max: number;
start: number;
unit: string;
}
export const CONTROLS: Control[] = [
{ name: 'vert', label: 'vertical exaggeration:', min: 1, max: 5, start: 1, unit: 'x' },
{ name: 'sunEl', label: 'sun elevation:', min: 0, max: 90, start: 45, unit: '°' },
{ name: 'sunAz', label: 'sun azimuth:', min: 0, max: 360, start: 45, unit: '°' },
];
export const ATTRIBUTIONS =
'Elevation: <a href="https://github.com/tilezen/joerd/blob/master/docs/attribution.md" target="_blank">Terrain Tiles</a>';How the React version works
A shaded relief computed per pixel by a raster source from Terrarium elevation tiles, drawn at 0.3 opacity over OpenStreetMap at the gorge of the Prądnik in Ojców; sliders set the vertical exaggeration and the sun's elevation and azimuth.
What both versions share
OpenLayers renders the map and handles the interactions; the cc-openlayers/core layer gives both adapters the same view binding (MapViewBinding) and the same conversion of coordinates from EPSG:4326 to the map's projection. Both versions import shade, the controls and the attribution from the example's .shared.ts file, so the logic exists once. The raster source turns the operation into source text for its worker.
From Angular to React
| Angular | React |
|---|---|
<aol-layer-image> with <aol-source-raster [operation] (beforeOperations)> around <aol-source-imagetile> | <ImageLayer> with <RasterSource operation onBeforeOperations> around <ImageTileSource> |
viewChild of the raster source and changed() after a control | ref on RasterSource (useRef) and changed() in the handler |
a signal of the control values | useState of the values, read in onBeforeOperations |
Who creates, updates and disposes
Map creates the ol/Map in useLayoutEffect and disposes of it on unmount; each layer, source and interaction component adds its object to the parent it gets from context and removes it in its effect's cleanup, as ngOnDestroy does in Angular.
Architecture and OpenLayers mechanics
aol-source-raster runs in whole-frame operationType="image" mode over aol-source-imagetile (which fetches Terrarium PNGs up to [maxZoom]="15" with CORS enabled by default). Before each pass, (beforeOperations) injects event.resolution alongside the three slider settings into event.data.
Worker function shade decodes heights scaled by vert, estimates east-west and north-south slope and aspect across the four cardinal neighbour pixels (2 * resolution span), and writes the Lambertian cosine of solar incidence as greyscale shading.
How it works
aol-source-rasterwithoperationType="image"passes fullImageDataframes from Terrarium tiles toshade.shadedecodes neighbour heights scaled byvert, derives slope and aspect across 2 × resolution, and computes solar incidence shading.(beforeOperations)forwardsevent.resolutionand the three illumination slider values, rendered at[opacity]="0.3"over OpenStreetMap.aol-source-imagetileenables anonymous CORS by default so the raster worker can read decoded tile pixels.
Pitfalls
event.resolutionis reported in Web Mercator units—roughly 1.56× true ground metres at 50° N latitude—which makes uncompensated slopes appear ~0.64× flatter unless compensated or boosted via vertical exaggeration.- If you swap
aol-source-imagetilefor aol-source-xyz, remember to add crossOrigin="anonymous" explicitly so pixel reads are not blocked by CORS.
Related examples
The same feature in the OpenLayers examples .
Background: state and lifecycle of maps in Angular with OpenLayers, which the components of cc-openlayers take care of.