Vector data · Angular, React and OpenLayers
Cluster points by distance
Group 2,000 dense points dynamically in OpenLayers with aol-source-cluster and adjust the pixel clustering distance live with a reactive slider.
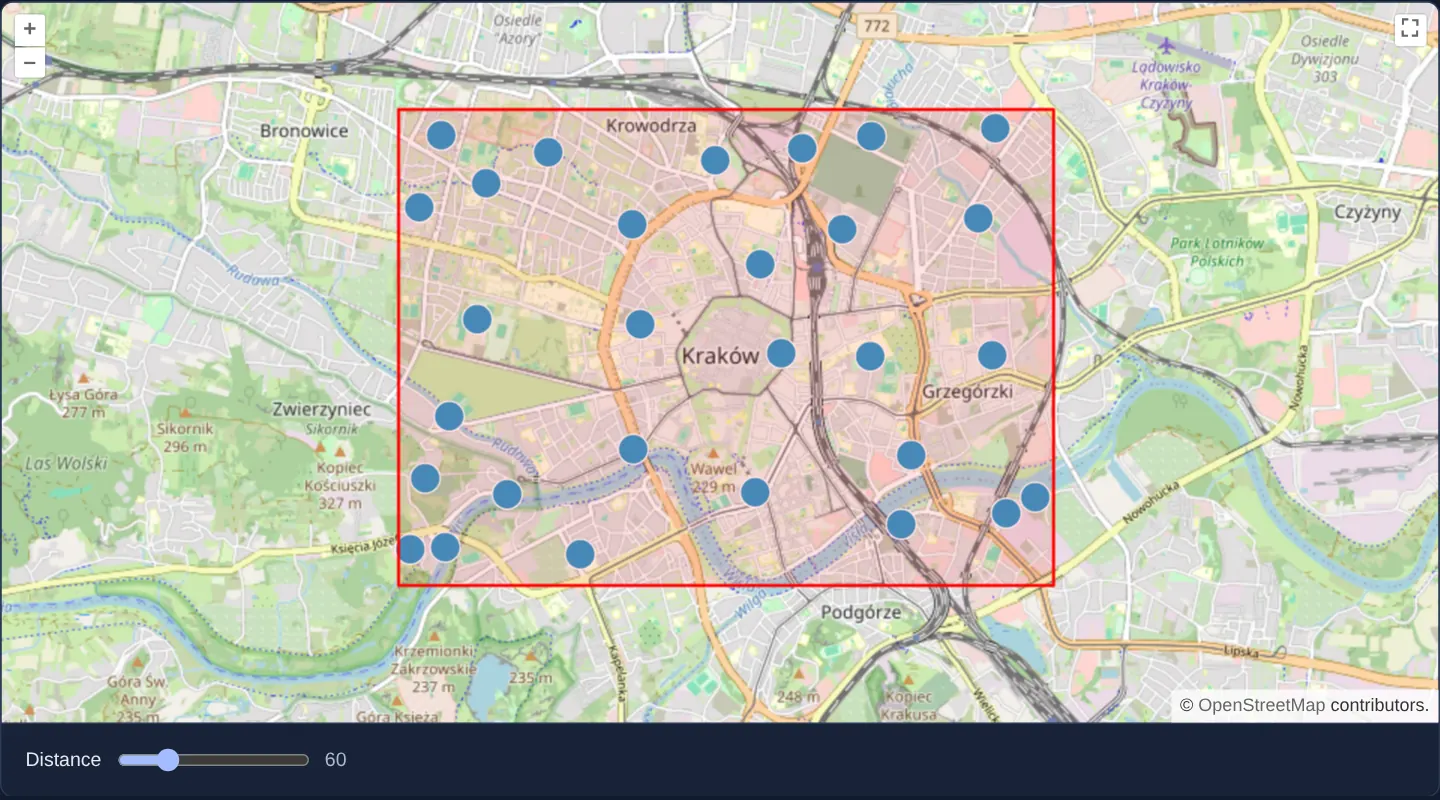
What this example shows
Inside a red bounding frame over central Kraków, 2,000 deterministic pseudo-random points are grouped into clean blue circles by an OpenLayers cluster source.
Zooming in splits clusters smoothly into smaller local groups and individual points, while dragging the distance slider below the map regroups the entire dataset live in screen pixels.
When you need it
Plotting thousands of parcel centroids, IoT sensors, store locations or incident pins directly at city or regional scales creates an illegible overlapping pile and slows frame rates.
Screen-space distance clustering keeps point density readable at every zoom level while preserving exact individual coordinates as soon as the user zooms in.
The code
The example uses cc-openlayers, my Angular component library for OpenLayers: each aol-… element creates the OpenLayers object it names, updates it from its inputs and disposes of it with the component.
cluster.shared.ts// The seeded points both versions place, so they show the same map.
/** Points inside the area, rounded to four decimals. */
export function randomPoints(count: number, random: () => number): { x: number; y: number }[] {
const between = (from: number, to: number) => Math.round((random() * (to - from) + from) * 1e4) / 1e4;
return Array.from({ length: count }, () => ({ x: between(19.9, 19.975), y: between(50.045, 50.08) }));
}
/** A small seeded pseudo-random generator, so every render shows the same points. */
export function mulberry32(seed: number): () => number {
return () => {
seed = (seed + 0x6d2b79f5) | 0;
let t = Math.imul(seed ^ (seed >>> 15), 1 | seed);
t = (t + Math.imul(t ^ (t >>> 7), 61 | t)) ^ t;
return ((t ^ (t >>> 14)) >>> 0) / 4294967296;
};
}cluster.tsimport { ChangeDetectionStrategy, Component, signal } from '@angular/core';
import {
CollectionCoordinatesComponent,
ControlFullScreenComponent,
CoordinateComponent,
DefaultControlComponent,
DefaultInteractionComponent,
FeatureComponent,
GeometryPointComponent,
GeometryPolygonComponent,
LayerTileComponent,
LayerVectorComponent,
MapComponent,
SourceClusterComponent,
SourceOsmComponent,
SourceVectorComponent,
StyleCircleComponent,
StyleComponent,
StyleFillComponent,
StyleStrokeComponent,
ViewComponent,
} from 'cc-openlayers';
import { mulberry32, randomPoints } from './cluster.shared';
/** Two thousand points inside a rectangle, grouped by a cluster source whose distance follows a slider. */
@Component({
selector: 'app-cluster',
imports: [
CollectionCoordinatesComponent,
ControlFullScreenComponent,
CoordinateComponent,
DefaultControlComponent,
DefaultInteractionComponent,
FeatureComponent,
GeometryPointComponent,
GeometryPolygonComponent,
LayerTileComponent,
LayerVectorComponent,
MapComponent,
SourceClusterComponent,
SourceOsmComponent,
SourceVectorComponent,
StyleCircleComponent,
StyleComponent,
StyleFillComponent,
StyleStrokeComponent,
ViewComponent,
],
changeDetection: ChangeDetectionStrategy.OnPush,
template: `
<aol-map height="480px">
<aol-interaction-default />
<aol-control-defaults />
<aol-control-fullscreen />
<aol-view [zoom]="13">
<aol-coordinate [x]="19.9368" [y]="50.0614" srid="EPSG:4326" />
</aol-view>
<aol-layer-tile><aol-source-osm /></aol-layer-tile>
<aol-layer-vector>
<aol-source-cluster [distance]="distance()">
<aol-source-vector>
@for (point of points; track $index) {
<aol-feature>
<aol-geometry-point><aol-coordinate [x]="point.x" [y]="point.y" srid="EPSG:4326" /></aol-geometry-point>
</aol-feature>
}
</aol-source-vector>
<aol-style>
<aol-style-circle [radius]="10">
<aol-style-stroke color="#fff" />
<aol-style-fill color="#3399CC" />
</aol-style-circle>
</aol-style>
</aol-source-cluster>
</aol-layer-vector>
<aol-layer-vector>
<aol-source-vector>
<aol-feature>
<aol-geometry-polygon>
<aol-collection-coordinates [coordinates]="area" srid="EPSG:4326" />
</aol-geometry-polygon>
<aol-style>
<aol-style-stroke color="red" [width]="2" />
<aol-style-fill [color]="[255, 0, 0, 0.1]" />
</aol-style>
</aol-feature>
</aol-source-vector>
</aol-layer-vector>
</aol-map>
<div class="example-controls">
<label>
Distance <input type="range" min="0" max="255" [value]="distance()" (input)="distance.set(number($event))" />
<output>{{ distance() }}</output>
</label>
</div>
`,
})
export class Cluster {
readonly distance = signal(60);
protected readonly area = [
[
[19.9, 50.045],
[19.975, 50.045],
[19.975, 50.08],
[19.9, 50.08],
[19.9, 50.045],
],
];
protected readonly points = randomPoints(2000, mulberry32(42));
protected number(event: Event): number {
return (event.target as HTMLInputElement).valueAsNumber;
}
} The React version uses the library's React adapter, cc-openlayers/react: each component creates the OpenLayers object it names when it mounts, updates it from its props and disposes of it when it unmounts.
cluster.react.tsximport { useState } from 'react';
import {
CircleStyle,
ClusterSource,
CollectionCoordinates,
Coordinate,
DefaultControls,
DefaultInteractions,
Feature,
Fill,
FullScreenControl,
Map,
OSMSource,
PointGeometry,
PolygonGeometry,
Stroke,
Style,
TileLayer,
VectorLayer,
VectorSource,
View,
} from 'cc-openlayers/react';
import { mulberry32, randomPoints } from './cluster.shared';
const AREA = [
[
[19.9, 50.045],
[19.975, 50.045],
[19.975, 50.08],
[19.9, 50.08],
[19.9, 50.045],
],
];
const AREA_FILL = [255, 0, 0, 0.1];
/** Two thousand points inside a rectangle, grouped by a cluster source whose distance follows a slider. */
export function Cluster() {
const [distance, setDistance] = useState(60);
const [points] = useState(() => randomPoints(2000, mulberry32(42)));
return (
<>
<Map height="480px">
<DefaultInteractions />
<DefaultControls />
<FullScreenControl />
<View zoom={13}>
<Coordinate x={19.9368} y={50.0614} srid="EPSG:4326" />
</View>
<TileLayer>
<OSMSource />
</TileLayer>
<VectorLayer>
<ClusterSource distance={distance}>
<VectorSource>
{points.map((point, index) => (
<Feature key={index}>
<PointGeometry>
<Coordinate x={point.x} y={point.y} srid="EPSG:4326" />
</PointGeometry>
</Feature>
))}
</VectorSource>
<Style>
<CircleStyle radius={10}>
<Stroke color="#fff" />
<Fill color="#3399CC" />
</CircleStyle>
</Style>
</ClusterSource>
</VectorLayer>
<VectorLayer>
<VectorSource>
<Feature>
<PolygonGeometry>
<CollectionCoordinates coordinates={AREA} srid="EPSG:4326" />
</PolygonGeometry>
<Style>
<Stroke color="red" width={2} />
<Fill color={AREA_FILL} />
</Style>
</Feature>
</VectorSource>
</VectorLayer>
</Map>
<div className="example-controls">
<label>
Distance{' '}
<input
type="range"
min="0"
max="255"
value={distance}
onChange={(event) => setDistance(event.target.valueAsNumber)}
/>
<output>{distance}</output>
</label>
</div>
</>
);
}cluster.shared.ts// The seeded points both versions place, so they show the same map.
/** Points inside the area, rounded to four decimals. */
export function randomPoints(count: number, random: () => number): { x: number; y: number }[] {
const between = (from: number, to: number) => Math.round((random() * (to - from) + from) * 1e4) / 1e4;
return Array.from({ length: count }, () => ({ x: between(19.9, 19.975), y: between(50.045, 50.08) }));
}
/** A small seeded pseudo-random generator, so every render shows the same points. */
export function mulberry32(seed: number): () => number {
return () => {
seed = (seed + 0x6d2b79f5) | 0;
let t = Math.imul(seed ^ (seed >>> 15), 1 | seed);
t = (t + Math.imul(t ^ (t >>> 7), 61 | t)) ^ t;
return ((t ^ (t >>> 14)) >>> 0) / 4294967296;
};
}How the React version works
Two thousand points in a rectangle over the Old Town, clustered by a Cluster source; a slider changes the clustering distance.
What both versions share
OpenLayers renders the map and handles the interactions; the cc-openlayers/core layer gives both adapters the same view binding (MapViewBinding) and the same conversion of coordinates from EPSG:4326 to the map's projection. A seeded generator draws the points, so every render shows the same ones.
From Angular to React
| Angular | React |
|---|---|
<aol-source-cluster [distance]> | <ClusterSource distance={distance}> |
the slider's (input) and a signal | onChange (React's input event) and useState |
@for over the points with <aol-feature> | points.map(…) with <Feature key={index}> |
Who creates, updates and disposes
Map creates the ol/Map in useLayoutEffect and disposes of it on unmount; each layer, source and interaction component adds its object to the parent it gets from context and removes it in its effect's cleanup, as ngOnDestroy does in Angular.
Architecture and OpenLayers mechanics
aol-source-cluster wraps the underlying aol-source-vector holding the 2,000 seeded points and merges neighbours closer than distance CSS pixels into synthetic cluster features, each exposing its member array.
Binding the range slider to the distance signal updates the cluster threshold reactively and triggers immediate spatial regrouping without re-fetching source data, while a companion vector layer outlines the dataset’s bounding area in red.
How it works
aol-source-clusterwraps the rawaol-source-vectorand merges points separated by fewer thandistancepixels.- Adjusting the slider updates the
distancesignal and regroups visible clusters instantaneously. - A seeded pseudo-random generator produces identical point positions across renders and screenshots.
- A separate vector layer outlines the rectangular generation envelope in red.
Pitfalls
- Always display the member count (or scale symbol size/colour) in your cluster style—drawing uniform unlabelled circles hides whether a marker represents one point or five hundred.
- For thousands of points, populate the underlying vector source programmatically in TypeScript rather than instantiating thousands of individual
aol-featuretemplate components.
Related examples
The same feature in the OpenLayers examples .
Background: state and lifecycle of maps in Angular with OpenLayers, which the components of cc-openlayers take care of.