Vector data · Angular, React and OpenLayers
Clusters drawn at the size of their extent
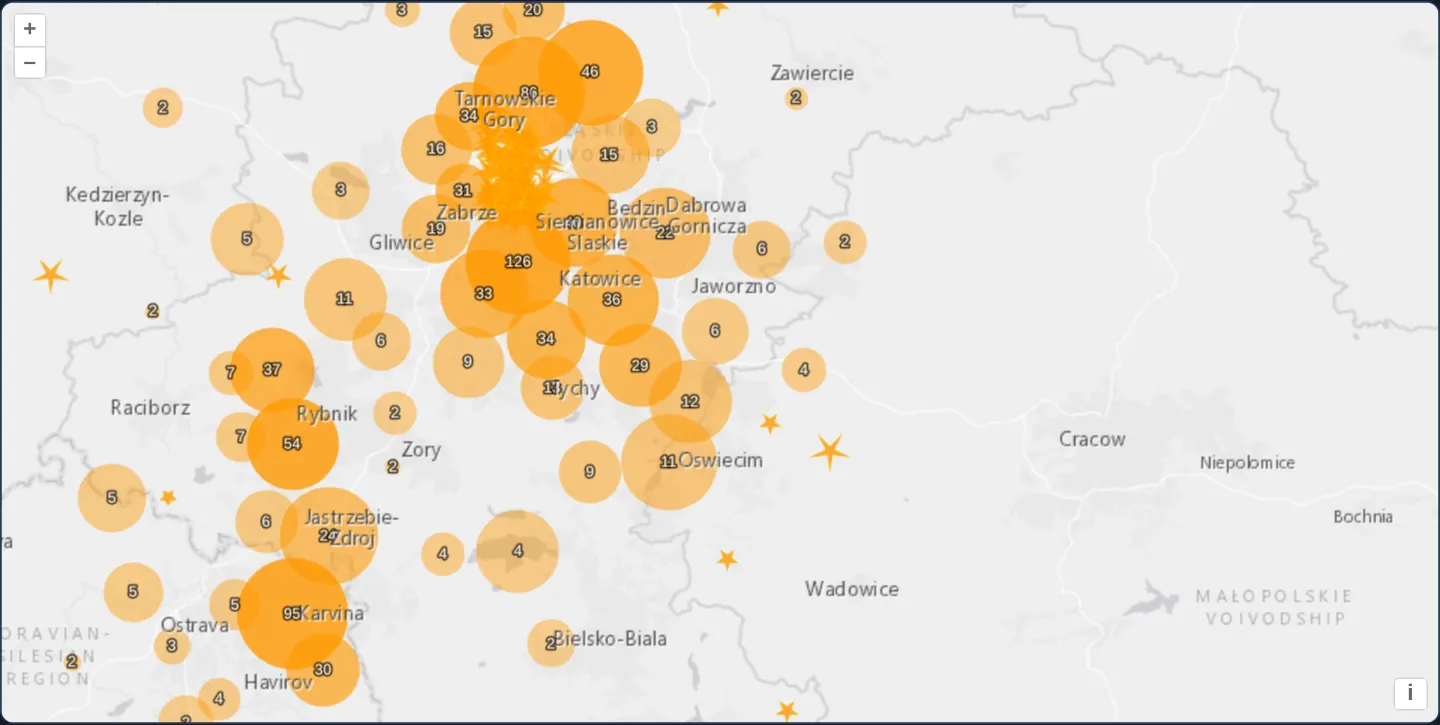
Cluster 1,130 KML seismic events in OpenLayers as extent-sized circles that expand on hover or click into magnitude-scaled five-pointed stars.
What this example shows
Across Upper Silesia west of Kraków over a light-grey basemap, 1,130 seismic events from KML aggregate into numbered orange circles whose pixel radius reflects the actual spatial spread of their member tremors and whose opacity deepens with event count.
Hovering over or clicking any cluster reveals every constituent seismic event inside it as an individual five-pointed star scaled by magnitude.
When you need it
Fixed-radius cluster badges hide whether 50 grouped events occurred at a single mine shaft or across a 20-kilometre fault zone.
Sizing each cluster circle to its members’ bounding extent—and fanning out individual styled symbols on hover—communicates both spatial footprint and individual event severity without forcing a zoom jump.
The code
The example uses cc-openlayers, my Angular component library for OpenLayers: each aol-… element creates the OpenLayers object it names, updates it from its inputs and disposes of it with the component.
earthquake-clusters.tsimport { ChangeDetectionStrategy, Component, viewChild } from '@angular/core';
import { createEmpty, extend, getHeight, getWidth } from 'ol/extent';
import type Feature from 'ol/Feature';
import type { FeatureLike } from 'ol/Feature';
import KML from 'ol/format/KML';
import type Geometry from 'ol/geom/Geometry';
import type MapBrowserEvent from 'ol/MapBrowserEvent';
import CircleStyle from 'ol/style/Circle';
import Fill from 'ol/style/Fill';
import RegularShape from 'ol/style/RegularShape';
import Stroke from 'ol/style/Stroke';
import Style from 'ol/style/Style';
import Text from 'ol/style/Text';
import {
CoordinateComponent,
DefaultControlComponent,
DefaultInteractionComponent,
LayerTileComponent,
LayerVectorComponent,
MapComponent,
SelectInteractionComponent,
SourceClusterComponent,
SourceImageTileComponent,
SourceVectorComponent,
ViewComponent,
} from 'cc-openlayers';
const earthquakeFill = new Fill({
color: 'rgba(255, 153, 0, 0.8)',
});
const earthquakeStroke = new Stroke({
color: 'rgba(255, 204, 0, 0.2)',
width: 1,
});
const textFill = new Fill({
color: '#fff',
});
const textStroke = new Stroke({
color: 'rgba(0, 0, 0, 0.6)',
width: 3,
});
const invisibleFill = new Fill({
color: 'rgba(255, 255, 255, 0.01)',
});
function createEarthquakeStyle(feature: Feature): Style {
// tremors.kml names each event by its magnitude, "M 3.4 - 1995 Mar 7"; every event has a magnitude of 2 or more.
const name: string = feature.get('name');
const magnitude = parseFloat(name.slice(2));
// Sized for the events' density: most of them are 2 to 3 and lie within some 50 km.
const radius = 4 + 6 * (magnitude - 2);
return new Style({
geometry: feature.getGeometry(),
image: new RegularShape({
radius: radius,
radius2: 3,
points: 5,
angle: Math.PI,
fill: earthquakeFill,
stroke: earthquakeStroke,
}),
});
}
/**
* The seismic events of a box around Kraków since 1978, all of them west of the city and most of them mining tremors
* of the Upper Silesian coal basin, read from a KML file and clustered: a cluster is a circle as large as the extent
* of its events, more opaque the more events it holds; a single event is a star sized by its magnitude. Hovering or
* clicking a cluster selects it, and the selection shows its events.
*/
@Component({
selector: 'app-earthquake-clusters',
imports: [
CoordinateComponent,
DefaultControlComponent,
DefaultInteractionComponent,
LayerTileComponent,
LayerVectorComponent,
MapComponent,
SelectInteractionComponent,
SourceClusterComponent,
SourceImageTileComponent,
SourceVectorComponent,
ViewComponent,
],
changeDetection: ChangeDetectionStrategy.OnPush,
template: `
<aol-map height="480px">
<aol-interaction-default />
<aol-interaction-select [condition]="condition" [style]="selectStyleFunction" />
<aol-control-defaults />
<aol-view [zoom]="9">
<aol-coordinate [x]="19.25" [y]="50.15" srid="EPSG:4326" />
</aol-view>
<aol-layer-tile>
<aol-source-imagetile
url="https://server.arcgisonline.com/ArcGIS/rest/services/Canvas/World_Light_Gray_Base/MapServer/tile/{z}/{y}/{x}"
[maxZoom]="16"
attributions="Tiles © Esri — Esri, HERE, Garmin, © OpenStreetMap contributors, and the GIS user community"
/>
</aol-layer-tile>
<aol-layer-vector [style]="styleFunction">
<aol-source-cluster [distance]="40">
<aol-source-vector
url="assets/krakow/tremors.kml"
[format]="format"
attributions="Seismic events: U.S. Geological Survey"
/>
</aol-source-cluster>
</aol-layer-vector>
<aol-layer-tile>
<aol-source-imagetile
url="https://server.arcgisonline.com/ArcGIS/rest/services/Canvas/World_Light_Gray_Reference/MapServer/tile/{z}/{y}/{x}"
[maxZoom]="16"
/>
</aol-layer-tile>
</aol-map>
`,
})
export class EarthquakeClusters {
protected readonly format = new KML({
extractStyles: false,
});
private readonly cluster = viewChild.required(SourceClusterComponent);
private maxFeatureCount = 0;
private currentResolution: number | undefined;
private calculateClusterInfo(resolution: number): void {
this.maxFeatureCount = 0;
const features = this.cluster().instance.getFeatures();
let feature, radius;
for (let i = features.length - 1; i >= 0; --i) {
feature = features[i];
const originalFeatures: Feature[] = feature.get('features');
const extent = createEmpty();
let j, jj;
for (j = 0, jj = originalFeatures.length; j < jj; ++j) {
extend(extent, (originalFeatures[j].getGeometry() as Geometry).getExtent());
}
this.maxFeatureCount = Math.max(this.maxFeatureCount, jj);
radius = (0.25 * (getWidth(extent) + getHeight(extent))) / resolution;
feature.set('radius', radius);
}
}
protected readonly styleFunction = (feature: FeatureLike, resolution: number): Style => {
if (resolution != this.currentResolution) {
this.calculateClusterInfo(resolution);
this.currentResolution = resolution;
}
let style;
const size = feature.get('features').length;
if (size > 1) {
style = new Style({
image: new CircleStyle({
radius: feature.get('radius'),
fill: new Fill({
color: [255, 153, 0, Math.min(0.8, 0.4 + size / this.maxFeatureCount)],
}),
}),
text: new Text({
text: size.toString(),
fill: textFill,
stroke: textStroke,
}),
});
} else {
const originalFeature = feature.get('features')[0];
style = createEarthquakeStyle(originalFeature);
}
return style;
};
protected readonly selectStyleFunction = (feature: FeatureLike): Style[] => {
const styles = [
new Style({
image: new CircleStyle({
radius: feature.get('radius'),
fill: invisibleFill,
}),
}),
];
const originalFeatures: Feature[] = feature.get('features');
let originalFeature;
for (let i = originalFeatures.length - 1; i >= 0; --i) {
originalFeature = originalFeatures[i];
styles.push(createEarthquakeStyle(originalFeature));
}
return styles;
};
protected readonly condition = function (evt: MapBrowserEvent): boolean {
return evt.type == 'pointermove' || evt.type == 'singleclick';
};
} The React version uses the library's React adapter, cc-openlayers/react: each component creates the OpenLayers object it names when it mounts, updates it from its props and disposes of it when it unmounts.
earthquake-clusters.react.tsximport { useMemo, useRef } from 'react';
import { createEmpty, extend, getHeight, getWidth } from 'ol/extent.js';
import type Feature from 'ol/Feature.js';
import type { FeatureLike } from 'ol/Feature.js';
import KML from 'ol/format/KML.js';
import type Geometry from 'ol/geom/Geometry.js';
import type MapBrowserEvent from 'ol/MapBrowserEvent.js';
import type OLCluster from 'ol/source/Cluster.js';
import CircleStyle from 'ol/style/Circle.js';
import Fill from 'ol/style/Fill.js';
import RegularShape from 'ol/style/RegularShape.js';
import Stroke from 'ol/style/Stroke.js';
import Style from 'ol/style/Style.js';
import Text from 'ol/style/Text.js';
import {
ClusterSource,
Coordinate,
DefaultControls,
DefaultInteractions,
ImageTileSource,
Map,
SelectInteraction,
TileLayer,
VectorLayer,
VectorSource,
View,
} from 'cc-openlayers/react';
const earthquakeFill = new Fill({
color: 'rgba(255, 153, 0, 0.8)',
});
const earthquakeStroke = new Stroke({
color: 'rgba(255, 204, 0, 0.2)',
width: 1,
});
const textFill = new Fill({
color: '#fff',
});
const textStroke = new Stroke({
color: 'rgba(0, 0, 0, 0.6)',
width: 3,
});
const invisibleFill = new Fill({
color: 'rgba(255, 255, 255, 0.01)',
});
function createEarthquakeStyle(feature: Feature): Style {
// tremors.kml names each event by its magnitude, "M 3.4 - 1995 Mar 7"; every event has a magnitude of 2 or more.
const name: string = feature.get('name');
const magnitude = parseFloat(name.slice(2));
// Sized for the events' density: most of them are 2 to 3 and lie within some 50 km.
const radius = 4 + 6 * (magnitude - 2);
return new Style({
geometry: feature.getGeometry(),
image: new RegularShape({
radius: radius,
radius2: 3,
points: 5,
angle: Math.PI,
fill: earthquakeFill,
stroke: earthquakeStroke,
}),
});
}
const format = new KML({
extractStyles: false,
});
const selectStyleFunction = (feature: FeatureLike): Style[] => {
const styles = [
new Style({
image: new CircleStyle({
radius: feature.get('radius'),
fill: invisibleFill,
}),
}),
];
const originalFeatures: Feature[] = feature.get('features');
let originalFeature;
for (let i = originalFeatures.length - 1; i >= 0; --i) {
originalFeature = originalFeatures[i];
styles.push(createEarthquakeStyle(originalFeature));
}
return styles;
};
const condition = function (evt: MapBrowserEvent): boolean {
return evt.type == 'pointermove' || evt.type == 'singleclick';
};
/**
* The seismic events of a box around Kraków since 1978, all of them west of the city and most of them mining tremors
* of the Upper Silesian coal basin, read from a KML file and clustered: a cluster is a circle as large as the extent
* of its events, more opaque the more events it holds; a single event is a star sized by its magnitude. Hovering or
* clicking a cluster selects it, and the selection shows its events.
*/
export function EarthquakeClusters() {
const cluster = useRef<OLCluster>(null);
const styleFunction = useMemo(() => {
let maxFeatureCount = 0;
let currentResolution: number | undefined;
const calculateClusterInfo = (resolution: number): void => {
maxFeatureCount = 0;
const features = cluster.current?.getFeatures() ?? [];
let feature, radius;
for (let i = features.length - 1; i >= 0; --i) {
feature = features[i];
const originalFeatures: Feature[] = feature.get('features');
const extent = createEmpty();
let j, jj;
for (j = 0, jj = originalFeatures.length; j < jj; ++j) {
extend(extent, (originalFeatures[j].getGeometry() as Geometry).getExtent());
}
maxFeatureCount = Math.max(maxFeatureCount, jj);
radius = (0.25 * (getWidth(extent) + getHeight(extent))) / resolution;
feature.set('radius', radius);
}
};
return (feature: FeatureLike, resolution: number): Style => {
if (resolution != currentResolution) {
calculateClusterInfo(resolution);
currentResolution = resolution;
}
let style;
const size = feature.get('features').length;
if (size > 1) {
style = new Style({
image: new CircleStyle({
radius: feature.get('radius'),
fill: new Fill({
color: [255, 153, 0, Math.min(0.8, 0.4 + size / maxFeatureCount)],
}),
}),
text: new Text({
text: size.toString(),
fill: textFill,
stroke: textStroke,
}),
});
} else {
const originalFeature = feature.get('features')[0];
style = createEarthquakeStyle(originalFeature);
}
return style;
};
}, []);
return (
<Map height="480px">
<DefaultInteractions />
<SelectInteraction condition={condition} style={selectStyleFunction} />
<DefaultControls />
<View zoom={9}>
<Coordinate x={19.25} y={50.15} srid="EPSG:4326" />
</View>
<TileLayer>
<ImageTileSource
url="https://server.arcgisonline.com/ArcGIS/rest/services/Canvas/World_Light_Gray_Base/MapServer/tile/{z}/{y}/{x}"
maxZoom={16}
attributions="Tiles © Esri — Esri, HERE, Garmin, © OpenStreetMap contributors, and the GIS user community"
/>
</TileLayer>
<VectorLayer style={styleFunction}>
<ClusterSource ref={cluster} distance={40}>
<VectorSource
url="assets/krakow/tremors.kml"
format={format}
attributions="Seismic events: U.S. Geological Survey"
/>
</ClusterSource>
</VectorLayer>
<TileLayer>
<ImageTileSource
url="https://server.arcgisonline.com/ArcGIS/rest/services/Canvas/World_Light_Gray_Reference/MapServer/tile/{z}/{y}/{x}"
maxZoom={16}
/>
</TileLayer>
</Map>
);
}How the React version works
Tremors from a KML file around Kraków (mostly mining tremors in Silesia) clustered 40 pixels apart: a cluster is a circle as large as its events' extent, a single event a star sized by its magnitude; selecting a cluster shows its events.
What both versions share
OpenLayers renders the map and handles the interactions; the cc-openlayers/core layer gives both adapters the same view binding (MapViewBinding) and the same conversion of coordinates from EPSG:4326 to the map's projection.
From Angular to React
| Angular | React |
|---|---|
<aol-source-cluster> with <aol-source-vector> | <ClusterSource distance={40}> with <VectorSource> |
<aol-interaction-select [condition]> | <SelectInteraction condition> |
viewChild of the cluster source in the style function | useRef<OLCluster> and a style function from useMemo |
Who creates, updates and disposes
Map creates the ol/Map in useLayoutEffect and disposes of it on unmount; each layer, source and interaction component adds its object to the parent it gets from context and removes it in its effect's cleanup, as ngOnDestroy does in Angular.
Architecture and OpenLayers mechanics
aol-source-cluster groups KML tremors (extractStyles: false) within [distance] (40 pixels), storing member records in features. Whenever view resolution changes, calculateClusterInfo computes each cluster’s pixel radius as one-quarter of the width plus height of its members’ bounding extent, pairing density-scaled orange fills with a Text count label (while unclustered singletons draw directly as a five-pointed RegularShape star with radius2: 3).
aol-interaction-select listens to both pointermove and singleclick, rendering all member stars atop an almost-transparent hit circle matching the cluster’s radius.
How it works
aol-source-clustergroups KML tremors closer than[distance](40 px), exposing grouped records viafeatures.calculateClusterInfomeasures each cluster’s member extent per resolution, setting circle radius and relative fill opacity alongside aTextcount.- Isolated single events render as five-pointed
RegularShapestars (radius2: 3) scaled by seismic magnitude. aol-interaction-selectonpointermoveandsingleclickreveals all member stars inside a cluster over a faint footprint circle.
Pitfalls
- Keep the nearly transparent cluster-sized circle underneath expanded member stars in the selection style: OpenLayers hit-tests the selected feature’s rendered geometry, so without that backing circle moving the cursor into a gap between two stars drops selection and causes rapid hover flicker.
- Pass
extractStyles: falseon the KML format so default Google Earth pushpins do not override your cluster and star style functions. - When datasets scale into tens of thousands of clusters, cache
Styleinstances by bucketed radius/count rather than allocating new objects on every frame.
Related examples
The same feature in the OpenLayers examples .
Background: state and lifecycle of maps in Angular with OpenLayers, which the components of cc-openlayers take care of.