Raster, GeoTIFF and WebGL · Angular, React and OpenLayers
Vegetation and water from three bands
Combine 10 m and 20 m Sentinel-2 red, NIR and SWIR Cloud Optimized GeoTIFFs into one multi-index NDVI and NDWI WebGL composite in OpenLayers.
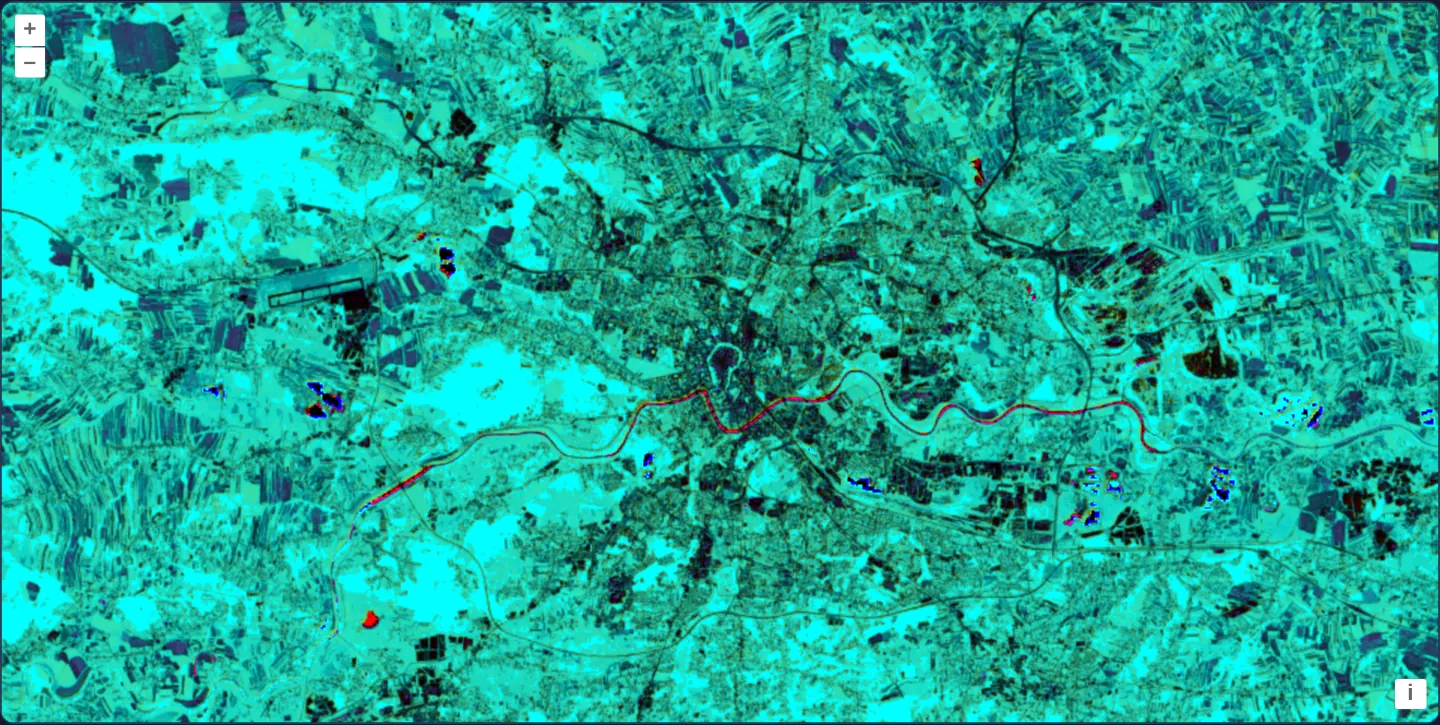
What this example shows
Centred on Kraków at [resolution]="40" in UTM zone 34N, three separate Sentinel-2 spectral band files of mixed native resolutions (10 m and 20 m) fuse on the GPU into one false-colour environmental composite: healthy forests and meadows glow bright cyan/green, built-up city blocks stay dark, and the Vistula river plus nearby gravel pits stand out sharply.
When you need it
Wetland delineation, flood-extent mapping and habitat classification simultaneously track vegetation vigour and surface moisture by combining visible, near-infrared (10 m) and short-wave infrared (20 m) channels.
OpenLayers’ GeoTIFF source resamples multi-resolution band files (10 m and 20 m) into aligned GPU textures automatically so WebGL shaders can cross-compute multiple spectral indices in a single pass.
The code
The example uses cc-openlayers, my Angular component library for OpenLayers: each aol-… element creates the OpenLayers object it names, updates it from its inputs and disposes of it with the component.
cog-math-multisource.shared.tsimport type { Coordinate } from 'ol/coordinate.js';
import type { ExpressionValue } from 'ol/expr/expression.js';
import type { Style } from 'ol/layer/WebGLTile.js';
import type { SourceInfo } from 'ol/source/GeoTIFF.js';
const SCENE =
'https://sentinel-cogs.s3.us-west-2.amazonaws.com/sentinel-s2-l2a-cogs/34/U/DA/2024/8/S2B_34UDA_20240814_0_L2A';
/** The Main Market Square in the scene's projection, UTM zone 34N (EPSG:32634). */
export const KRAKOW: Coordinate = [423901, 5545999];
/** Band 1 is red, band 2 near infrared (both 10 m), band 3 short-wave infrared (20 m); band 4 is the alpha band nodata adds. */
const ndvi: ExpressionValue = ['/', ['-', ['band', 2], ['band', 1]], ['+', ['band', 2], ['band', 1]]];
const ndwi: ExpressionValue = ['/', ['-', ['band', 3], ['band', 1]], ['+', ['band', 3], ['band', 1]]];
/** One band file of the scene, with 0 as nodata and the full 16-bit range. */
function band(name: string): SourceInfo {
return { url: `${SCENE}/${name}.tif`, min: 0, max: 65535, nodata: 0 };
}
export const SOURCES: SourceInfo[] = [band('B04'), band('B08'), band('B11')];
export const STYLE: Style = {
color: [
'color',
// red: | NDVI - NDWI |
['*', 255, ['abs', ['-', ndvi, ndwi]]],
// green: NDVI
['*', 255, ndvi],
// blue: NDWI
['*', 255, ndwi],
// alpha
['band', 4],
],
};cog-math-multisource.tsimport { ChangeDetectionStrategy, Component, signal } from '@angular/core';
import { DefaultControlComponent, DefaultInteractionComponent, MapComponent, ViewComponent } from 'cc-openlayers';
import { LayerWebGLTileComponent, SourceGeoTIFFComponent } from 'cc-openlayers/webgl';
import type { ViewOptions } from 'ol/View';
import { KRAKOW, SOURCES, STYLE } from './cog-math-multisource.shared';
/**
* NDVI as green and NDWI as blue (their difference as red), calculated from three Sentinel-2 COGs of a scene over
* Kraków: red and near infrared at 10 m and short-wave infrared at 20 m.
*/
@Component({
selector: 'app-cog-math-multisource',
imports: [
DefaultControlComponent,
DefaultInteractionComponent,
LayerWebGLTileComponent,
MapComponent,
SourceGeoTIFFComponent,
ViewComponent,
],
changeDetection: ChangeDetectionStrategy.OnPush,
template: `
<aol-map height="480px">
<aol-interaction-default />
<aol-control-defaults />
@if (view(); as options) {
<aol-view
[projection]="options.projection"
[resolutions]="options.resolutions"
[extent]="options.extent"
[center]="krakow"
[resolution]="40"
/>
}
<aol-layer-webgltile [style]="style">
<aol-source-geotiff
[sources]="sources"
attributions="Contains modified Copernicus Sentinel data 2024"
(viewReady)="view.set($event)"
/>
</aol-layer-webgltile>
</aol-map>
`,
})
export class CogMathMultisource {
readonly view = signal<ViewOptions | undefined>(undefined);
protected readonly krakow = KRAKOW;
protected readonly sources = SOURCES;
protected readonly style = STYLE;
} The React version uses the library's React adapter, cc-openlayers/react: each component creates the OpenLayers object it names when it mounts, updates it from its props and disposes of it when it unmounts.
cog-math-multisource.react.tsximport { useState } from 'react';
import type { ViewOptions } from 'ol/View.js';
import { DefaultControls, DefaultInteractions, Map, View } from 'cc-openlayers/react';
import { GeoTIFFSource, WebGLTileLayer } from 'cc-openlayers/react/webgl';
import { KRAKOW, SOURCES, STYLE } from './cog-math-multisource.shared';
/**
* NDVI as green and NDWI as blue (their difference as red), calculated from three Sentinel-2 COGs of a scene over
* Kraków: red and near infrared at 10 m and short-wave infrared at 20 m.
*/
export function CogMathMultisource() {
const [view, setView] = useState<ViewOptions | undefined>(undefined);
return (
<Map height="480px">
<DefaultInteractions />
<DefaultControls />
{view && (
<View
projection={view.projection}
resolutions={view.resolutions}
extent={view.extent}
center={KRAKOW}
resolution={40}
/>
)}
<WebGLTileLayer style={STYLE}>
<GeoTIFFSource
sources={SOURCES}
attributions="Contains modified Copernicus Sentinel data 2024"
onViewReady={setView}
/>
</WebGLTileLayer>
</Map>
);
}cog-math-multisource.shared.tsimport type { Coordinate } from 'ol/coordinate.js';
import type { ExpressionValue } from 'ol/expr/expression.js';
import type { Style } from 'ol/layer/WebGLTile.js';
import type { SourceInfo } from 'ol/source/GeoTIFF.js';
const SCENE =
'https://sentinel-cogs.s3.us-west-2.amazonaws.com/sentinel-s2-l2a-cogs/34/U/DA/2024/8/S2B_34UDA_20240814_0_L2A';
/** The Main Market Square in the scene's projection, UTM zone 34N (EPSG:32634). */
export const KRAKOW: Coordinate = [423901, 5545999];
/** Band 1 is red, band 2 near infrared (both 10 m), band 3 short-wave infrared (20 m); band 4 is the alpha band nodata adds. */
const ndvi: ExpressionValue = ['/', ['-', ['band', 2], ['band', 1]], ['+', ['band', 2], ['band', 1]]];
const ndwi: ExpressionValue = ['/', ['-', ['band', 3], ['band', 1]], ['+', ['band', 3], ['band', 1]]];
/** One band file of the scene, with 0 as nodata and the full 16-bit range. */
function band(name: string): SourceInfo {
return { url: `${SCENE}/${name}.tif`, min: 0, max: 65535, nodata: 0 };
}
export const SOURCES: SourceInfo[] = [band('B04'), band('B08'), band('B11')];
export const STYLE: Style = {
color: [
'color',
// red: | NDVI - NDWI |
['*', 255, ['abs', ['-', ndvi, ndwi]]],
// green: NDVI
['*', 255, ndvi],
// blue: NDWI
['*', 255, ndwi],
// alpha
['band', 4],
],
};How the React version works
The red, near-infrared and short-wave infrared files of a scene over Kraków combined in one style: red shows the difference, green the NDVI, blue the NDWI, with the alpha band. The source reads the file in the browser, so nothing is drawn before its metadata arrive.
What both versions share
OpenLayers renders the map and handles the interactions; the cc-openlayers/core layer gives both adapters the same view binding (MapViewBinding) and the same conversion of coordinates from EPSG:4326 to the map's projection. OpenLayers draws the tiles with WebGL; the style expressions run on the GPU in both versions. Both versions import the centre over Kraków, the two band sources and the NDVI style from the example's .shared.ts file, so the logic exists once.
From Angular to React
| Angular | React |
|---|---|
<aol-layer-webgltile> with <aol-source-geotiff [sources]> inside | <WebGLTileLayer> with <GeoTIFFSource sources> inside, both from cc-openlayers/react/webgl |
(viewReady) and a signal of the view options | onViewReady and useState; the View is rendered once the options are there |
Who creates, updates and disposes
Map creates the ol/Map in useLayoutEffect and disposes of it on unmount; each layer, source and interaction component adds its object to the parent it gets from context and removes it in its effect's cleanup, as ngOnDestroy does in Angular.
Architecture and OpenLayers mechanics
Helper band configures SOURCES over B04 (10 m red, band 1), B08 (10 m NIR, band 2) and B11 (20 m SWIR, band 3), each with min: 0, max: 65535, nodata: 0. In STYLE, ndvi computes (band2 - band1) / (band2 + band1) and ndwi computes (band3 - band1) / (band3 + band1).
An RGBA 'color' expression maps 255 * |ndvi - ndwi| to Red, 255 * ndvi to Green, 255 * ndwi to Blue, and passes ['band', 4]—the combined nodata alpha band—as the fourth channel.
How it works
bandconfiguresB04(10 m red),B08(10 m NIR) andB11(20 m SWIR) as bands 1–3, each withmin: 0, max: 65535, nodata: 0.ndvievaluates (band2 - band1) / (band2 + band1) whilendwievaluates (band3 - band1) / (band3 + band1).STYLEoutputs 255 * |ndvi - ndwi| in red, 255 * ndvi in green, 255 * ndwi in blue and['band', 4]as alpha.
Pitfalls
- When
nodatais set across multiple files in oneGeoTIFFsource, OpenLayers appends one shared alpha channel after the data bands of all files—making alpha['band', 4]after three single-band TIFFs, even if API docs can look as though alpha follows a single source. - Remember that WebGL's color operator expects 0..255 RGB values and a 0..1 alpha value, unlike the array operator which expects 0..1 across all four channels.
Related examples
The same feature in the OpenLayers examples .
Background: state and lifecycle of maps in Angular with OpenLayers, which the components of cc-openlayers take care of.