Raster, GeoTIFF and WebGL · Angular, React and OpenLayers
NDVI computed on the GPU
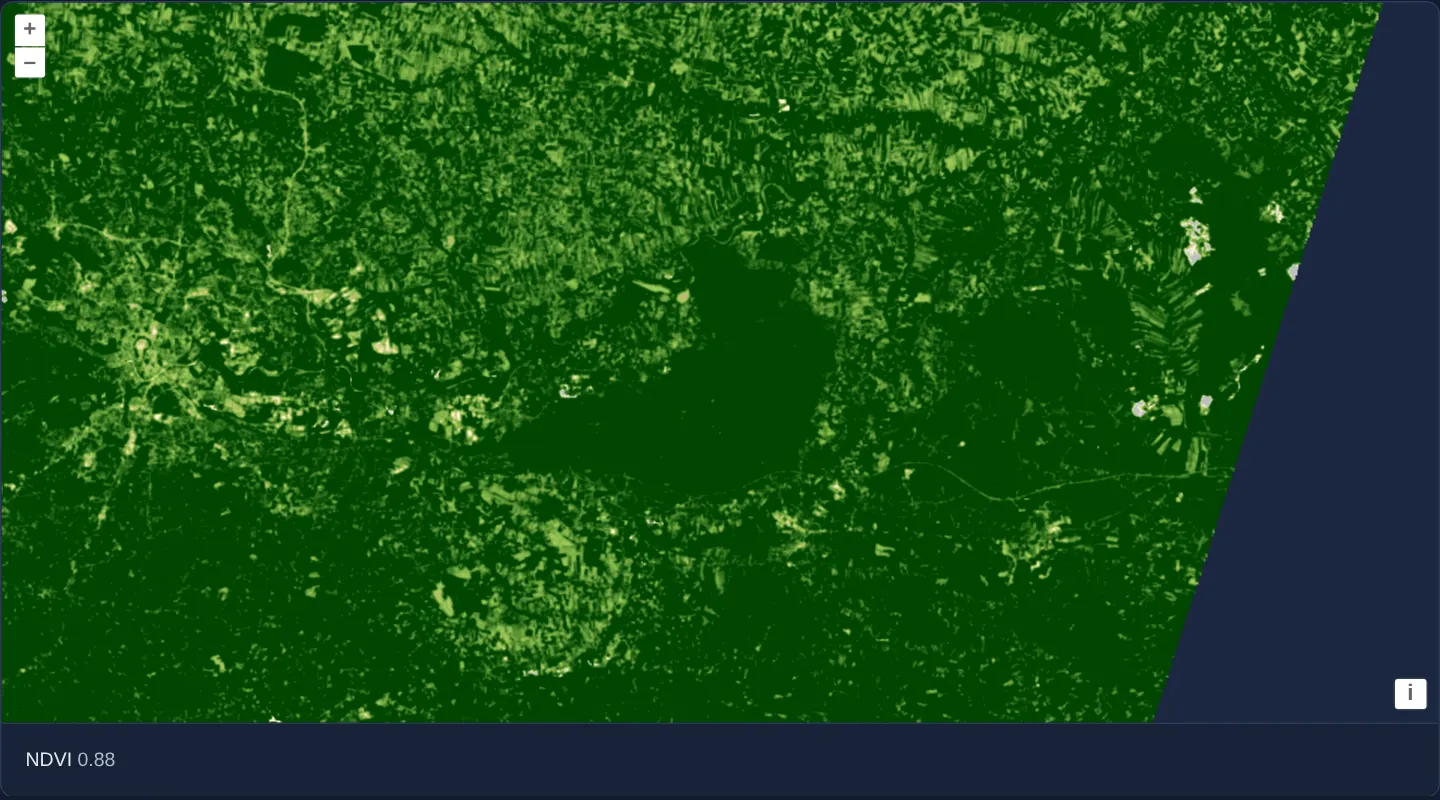
Compute Sentinel-2 NDVI on the GPU in an OpenLayers WebGL style from red and NIR COGs and inspect live pixel NDVI values via layer.getData().
What this example shows
Across Kraków and the dense Niepołomice Forest to the east, a two-band Sentinel-2 scene renders directly as a 20-stop Normalized Difference Vegetation Index (NDVI) map—colouring water, roofs and bare soil pale grey/beige and thriving forest canopies deep green.
Moving the pointer or clicking anywhere on the map reads the underlying pixel bands and prints the live two-decimal NDVI value (or an en dash – before interaction) inside the <output> readout below.
When you need it
Precision-agriculture platforms, urban green-canopy audits and drought monitors compute spectral band ratios (NDVI, NDWI, NBR) directly from single-band COGs stored on cloud object storage.
Evaluating band math on the GPU renders full-viewport vegetation maps at 60 fps while layer.getData(pixel) still gives analysts exact quantitative pixel values on hover or click.
The code
The example uses cc-openlayers, my Angular component library for OpenLayers: each aol-… element creates the OpenLayers object it names, updates it from its inputs and disposes of it with the component.
cog-math.tsimport { ChangeDetectionStrategy, Component, computed, signal, viewChild } from '@angular/core';
import { DefaultControlComponent, DefaultInteractionComponent, MapComponent, ViewComponent } from 'cc-openlayers';
import { LayerWebGLTileComponent, SourceGeoTIFFComponent } from 'cc-openlayers/webgl';
import type { MapBrowserEvent } from 'ol';
import type { ViewOptions } from 'ol/View';
import type { Style } from 'ol/layer/WebGLTile';
import type { SourceInfo } from 'ol/source/GeoTIFF';
const scene =
'https://sentinel-cogs.s3.us-west-2.amazonaws.com/sentinel-s2-l2a-cogs/34/U/DA/2024/8/S2B_34UDA_20240814_0_L2A';
/** NDVI values from -0.2 to 0.65 and the colour of each, from grey through yellow to dark green. */
const ramp: [number, [number, number, number]][] = [
[-0.2, [191, 191, 191]],
[-0.1, [219, 219, 219]],
[0, [255, 255, 224]],
[0.025, [255, 250, 204]],
[0.05, [237, 232, 181]],
[0.075, [222, 217, 156]],
[0.1, [204, 199, 130]],
[0.125, [189, 184, 107]],
[0.15, [176, 194, 97]],
[0.175, [163, 204, 89]],
[0.2, [145, 191, 82]],
[0.25, [128, 179, 71]],
[0.3, [112, 163, 64]],
[0.35, [97, 150, 54]],
[0.4, [79, 138, 46]],
[0.45, [64, 125, 36]],
[0.5, [48, 110, 28]],
[0.55, [33, 97, 18]],
[0.6, [15, 84, 10]],
[0.65, [0, 69, 0]],
];
/** Two Sentinel-2 bands of a scene over Kraków (red and near infrared) turned into NDVI colours; the pixel under the pointer is read back. */
@Component({
selector: 'app-cog-math',
imports: [
DefaultControlComponent,
DefaultInteractionComponent,
LayerWebGLTileComponent,
MapComponent,
SourceGeoTIFFComponent,
ViewComponent,
],
changeDetection: ChangeDetectionStrategy.OnPush,
template: `
<aol-map height="480px" (pointerMove)="showNdvi($event)" (singleClick)="showNdvi($event)">
<aol-interaction-default />
<aol-control-defaults />
@if (view(); as options) {
<aol-view
[projection]="options.projection"
[resolutions]="options.resolutions"
[extent]="options.extent"
[center]="options.center"
[zoom]="options.zoom"
/>
}
<aol-layer-webgltile [style]="style">
<aol-source-geotiff
[sources]="sources"
attributions="Contains modified Copernicus Sentinel data 2024"
(viewReady)="view.set($event)"
/>
</aol-layer-webgltile>
</aol-map>
<div class="example-controls">
<span>
NDVI <output>{{ ndvi() }}</output>
</span>
</div>
`,
})
export class CogMath {
readonly view = signal<ViewOptions | undefined>(undefined);
protected readonly layer = viewChild.required(LayerWebGLTileComponent);
protected readonly value = signal<string | undefined>(undefined);
protected readonly ndvi = computed(() => this.value() ?? '–');
/** Red is band 1 and near infrared band 2 of the style expression. */
protected readonly sources: SourceInfo[] = [
{ url: `${scene}/B04.tif`, max: 10000 },
{ url: `${scene}/B08.tif`, max: 10000 },
];
protected readonly style: Style = {
color: [
'interpolate',
['linear'],
['/', ['-', ['band', 2], ['band', 1]], ['+', ['band', 2], ['band', 1]]],
...ramp.flat(),
],
};
/**
* Calculates the NDVI of the pixel under the pointer from its red and near-infrared values in the data tile. The
* source scaled both bands alike, from 0–10000 to 0–255, so the ratio holds up to the rounding to whole bytes.
*/
protected showNdvi(event: MapBrowserEvent): void {
const data = this.layer().instance.getData(event.pixel);
if (!data || data instanceof DataView) return;
const [red, nir] = data;
this.value.set(nir + red === 0 ? undefined : ((nir - red) / (nir + red)).toFixed(2));
}
} The React version uses the library's React adapter, cc-openlayers/react: each component creates the OpenLayers object it names when it mounts, updates it from its props and disposes of it when it unmounts.
cog-math.react.tsximport { useCallback, useState } from 'react';
import type { MapBrowserEvent } from 'ol';
import type OLWebGLTileLayer from 'ol/layer/WebGLTile.js';
import type { Style } from 'ol/layer/WebGLTile.js';
import type { SourceInfo } from 'ol/source/GeoTIFF.js';
import type { ViewOptions } from 'ol/View.js';
import { DefaultControls, DefaultInteractions, Map, View } from 'cc-openlayers/react';
import { GeoTIFFSource, WebGLTileLayer } from 'cc-openlayers/react/webgl';
const SCENE =
'https://sentinel-cogs.s3.us-west-2.amazonaws.com/sentinel-s2-l2a-cogs/34/U/DA/2024/8/S2B_34UDA_20240814_0_L2A';
/** NDVI values from -0.2 to 0.65 and the colour of each, from grey through yellow to dark green. */
const RAMP: [number, [number, number, number]][] = [
[-0.2, [191, 191, 191]],
[-0.1, [219, 219, 219]],
[0, [255, 255, 224]],
[0.025, [255, 250, 204]],
[0.05, [237, 232, 181]],
[0.075, [222, 217, 156]],
[0.1, [204, 199, 130]],
[0.125, [189, 184, 107]],
[0.15, [176, 194, 97]],
[0.175, [163, 204, 89]],
[0.2, [145, 191, 82]],
[0.25, [128, 179, 71]],
[0.3, [112, 163, 64]],
[0.35, [97, 150, 54]],
[0.4, [79, 138, 46]],
[0.45, [64, 125, 36]],
[0.5, [48, 110, 28]],
[0.55, [33, 97, 18]],
[0.6, [15, 84, 10]],
[0.65, [0, 69, 0]],
];
/** Red is band 1 and near infrared band 2 of the style expression. */
const SOURCES: SourceInfo[] = [
{ url: `${SCENE}/B04.tif`, max: 10000 },
{ url: `${SCENE}/B08.tif`, max: 10000 },
];
const STYLE: Style = {
color: [
'interpolate',
['linear'],
['/', ['-', ['band', 2], ['band', 1]], ['+', ['band', 2], ['band', 1]]],
...RAMP.flat(),
],
};
/** Two Sentinel-2 bands of a scene over Kraków (red and near infrared) turned into NDVI colours; the pixel under the pointer is read back. */
export function CogMath() {
const [view, setView] = useState<ViewOptions | undefined>(undefined);
const [layer, setLayer] = useState<OLWebGLTileLayer | null>(null);
const [value, setValue] = useState<string | undefined>(undefined);
const ndvi = value ?? '–';
/**
* Calculates the NDVI of the pixel under the pointer from its red and near-infrared values in the data tile. The
* source scaled both bands alike, from 0–10000 to 0–255, so the ratio holds up to the rounding to whole bytes.
*/
const showNdvi = useCallback(
(event: MapBrowserEvent) => {
const data = layer?.getData(event.pixel);
if (!data || data instanceof DataView) return;
const [red, nir] = data;
setValue(nir + red === 0 ? undefined : ((nir - red) / (nir + red)).toFixed(2));
},
[layer]
);
return (
<>
<Map height="480px" onPointerMove={showNdvi} onSingleClick={showNdvi}>
<DefaultInteractions />
<DefaultControls />
{view && (
<View
projection={view.projection}
resolutions={view.resolutions}
extent={view.extent}
center={view.center}
zoom={view.zoom}
/>
)}
<WebGLTileLayer ref={setLayer} style={STYLE}>
<GeoTIFFSource
sources={SOURCES}
attributions="Contains modified Copernicus Sentinel data 2024"
onViewReady={setView}
/>
</WebGLTileLayer>
</Map>
<div className="example-controls">
<span>
NDVI <output>{ndvi}</output>
</span>
</div>
</>
);
}How the React version works
The NDVI of the red and near-infrared bands of a Sentinel-2 scene over Kraków, coloured along a ramp from -0.2 to 0.65 by the layer style; the value under the pointer or a click is shown below the map. The source reads the file in the browser, so nothing is drawn before its metadata arrive.
What both versions share
OpenLayers renders the map and handles the interactions; the cc-openlayers/core layer gives both adapters the same view binding (MapViewBinding) and the same conversion of coordinates from EPSG:4326 to the map's projection. OpenLayers draws the tiles with WebGL; the style expressions run on the GPU in both versions.
From Angular to React
| Angular | React |
|---|---|
<aol-layer-webgltile> with <aol-source-geotiff [sources]> inside | <WebGLTileLayer> with <GeoTIFFSource sources> inside, both from cc-openlayers/react/webgl |
(viewReady) and a signal of the view options | onViewReady and useState; the View is rendered once the options are there |
viewChild of the layer and getData in (pointerMove) and (singleClick) | ref={setLayer} into useState and onPointerMove and onSingleClick reading getData from it |
Who creates, updates and disposes
Map creates the ol/Map in useLayoutEffect and disposes of it on unmount; each layer, source and interaction component adds its object to the parent it gets from context and removes it in its effect's cleanup, as ngOnDestroy does in Angular.
Architecture and OpenLayers mechanics
sources pairs B04.tif (red, band 1) and B08.tif (near-infrared, band 2), each configured with max: 10000 under default byte normalization (0..10000 scaled linearly to 0..255). On aol-layer-webgltile, [style] linearly interpolates ['/', ['-', ['band', 2], ['band', 1]], ['+', ['band', 2], ['band', 1]]] across 20 colour stops (-0.2 to 0.65).
On (pointerMove)="showNdvi($event)" and (singleClick)="showNdvi($event)", showNdvi queries this.layer().instance.getData(event.pixel) and formats ((nir - red) / (nir + red)).toFixed(2) when nir + red !== 0.
How it works
B04.tif(red) andB08.tif(near infrared) load as bands 1 and 2 withmax: 10000and native UTM view options from(viewReady).- The WebGL style interpolates
['/', ['-', ['band', 2], ['band', 1]], ['+', ['band', 2], ['band', 1]]]across 20 stops from-0.2(grey) to0.65(dark green). showNdvireads[red, nir]viagetData(event.pixel)on pointer move and single click, formatting NDVI to two decimals withtoFixed(2).
Pitfalls
getData(event.pixel)returns the scaled byte values (0..255) stored in the rendered tile texture rather than raw 0..10000 integers—the(nir - red) / (nir + red)formula stays mathematically valid (up to 8-bit rounding) strictly because both bands share identical min: 0 andmax: 10000scaling.- Guard against
nir + red === 0(outer nodata pixels) andDataViewreturn types before dividing so the readout falls back cleanly to–instead of NaN.
Related examples
The same feature in the OpenLayers examples .
Background: state and lifecycle of maps in Angular with OpenLayers, which the components of cc-openlayers take care of.