Raster, GeoTIFF and WebGL · Angular, React and OpenLayers
Shade terrain from a PMTiles archive
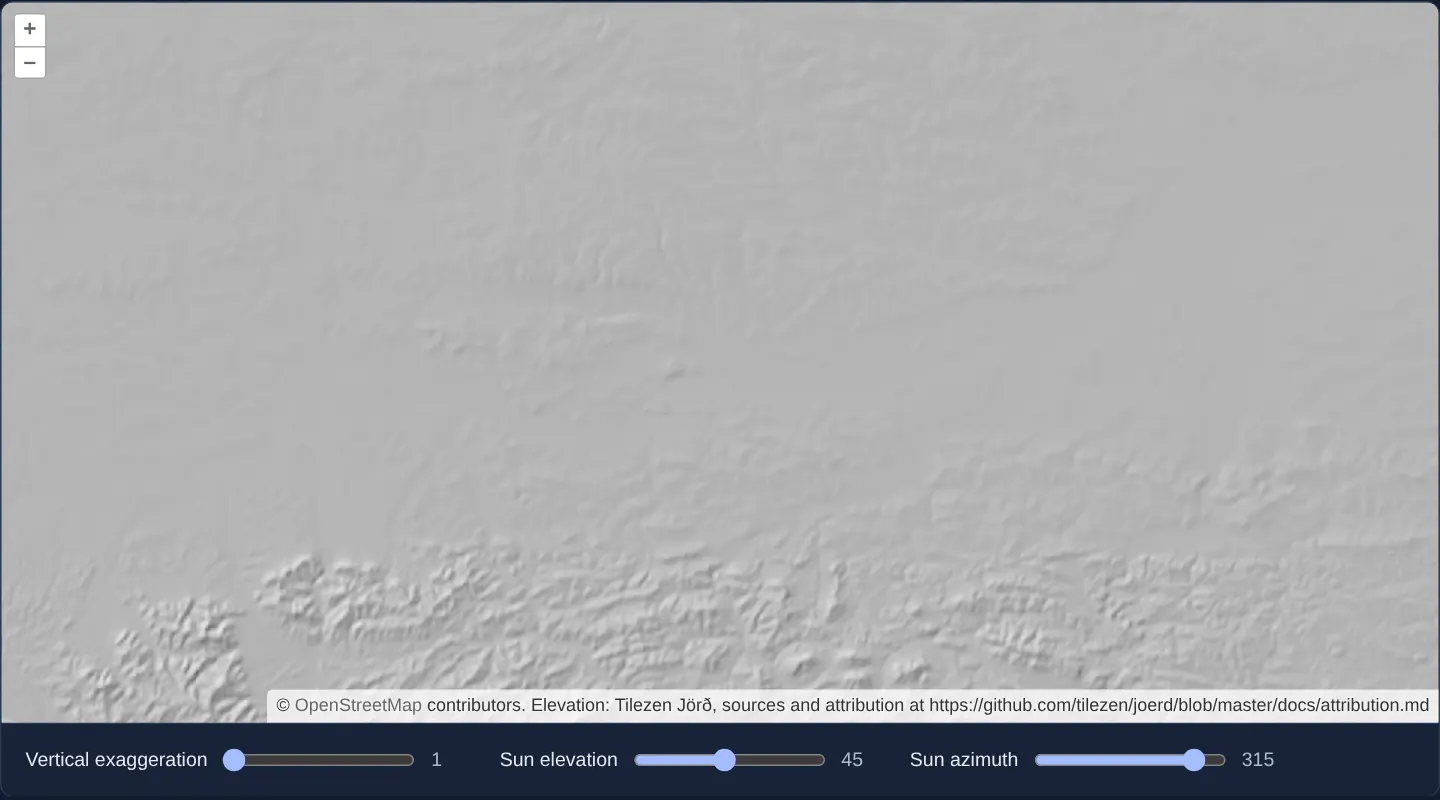
Decode Terrarium RGB elevation tiles from a serverless PMTiles archive in OpenLayers and adjust interactive GPU hillshade lighting in WebGL.
What this example shows
Over OpenStreetMap, RGB-encoded Terrarium elevation tiles stream from a single .pmtiles archive into a WebGLTileLayer that computes live shaded terrain relief on the GPU—complete with interactive sliders for vertical exaggeration (1×), sun elevation (45°) and sun azimuth (315°).
When you need it
Packaging regional or global digital elevation models (DEMs) into a single .pmtiles file eliminates millions of tiny S3 objects while still enabling instant GPU hillshading, flood analysis and elevation inspection in OpenLayers.
Combining pmtiles range reads, DataTileSource and WebGLTileLayer neighbour-pixel expressions delivers serverless 3D-style relief lighting.
The code
The example uses cc-openlayers, my Angular component library for OpenLayers: each aol-… element creates the OpenLayers object it names, updates it from its inputs and disposes of it with the component.
pmtiles-elevation.html<aol-map height="480px"
><aol-interaction-default /><aol-control-defaults /><aol-view [zoom]="9"
><aol-coordinate [x]="19.9368" [y]="50.0614" srid="EPSG:4326" /></aol-view
><aol-layer-tile><aol-source-osm /></aol-layer-tile
><aol-layer-webgltile [style]="style" [variables]="variables()"
><aol-source-datatile
[loader]="loader"
[maxZoom]="9"
[transition]="0"
[attributions]="credit" /></aol-layer-webgltile
></aol-map>
<div class="example-controls">
<label
>Vertical exaggeration<input
type="range"
min="1"
max="5"
[value]="variables().vert"
(input)="setValue('vert', $event)"
/><output>{{ variables().vert }}</output></label
><label
>Sun elevation<input
type="range"
min="5"
max="90"
[value]="variables().sunEl"
(input)="setValue('sunEl', $event)"
/><output>{{ variables().sunEl }}</output></label
><label
>Sun azimuth<input
type="range"
min="0"
max="360"
[value]="variables().sunAz"
(input)="setValue('sunAz', $event)"
/><output>{{ variables().sunAz }}</output></label
>
</div>pmtiles-elevation.shared.tsimport type { Style } from 'ol/layer/WebGLTile.js';
export const ELEVATION_ARCHIVE =
'https://pub-9288c68512ed46eca46ddcade307709b.r2.dev/protomaps-sample-datasets/terrarium_z9.pmtiles';
export const ELEVATION_CREDIT =
'Elevation: Tilezen Jörð, sources and attribution at https://github.com/tilezen/joerd/blob/master/docs/attribution.md';
function elevation(xOffset: number, yOffset: number) {
const red = ['band', 1, xOffset, yOffset];
const green = ['band', 2, xOffset, yOffset];
const blue = ['band', 3, xOffset, yOffset];
// band math operates on normalized values from 0-1
// so we scale by 255
return ['+', ['*', 255 * 256, red], ['*', 255, green], ['*', 255 / 256, blue], -32768];
}
// Generates a shaded relief image given elevation data. Uses a 3x3
// neighborhood for determining slope and aspect.
const dp = ['*', 2, ['resolution']];
const z0x = ['*', ['var', 'vert'], elevation(-1, 0)];
const z1x = ['*', ['var', 'vert'], elevation(1, 0)];
const dzdx = ['/', ['-', z1x, z0x], dp];
const z0y = ['*', ['var', 'vert'], elevation(0, -1)];
const z1y = ['*', ['var', 'vert'], elevation(0, 1)];
const dzdy = ['/', ['-', z1y, z0y], dp];
const slope = ['atan', ['sqrt', ['+', ['^', dzdx, 2], ['^', dzdy, 2]]]];
const aspect = ['clamp', ['atan', ['-', 0, dzdx], dzdy], -Math.PI, Math.PI];
const sunEl = ['*', Math.PI / 180, ['var', 'sunEl']];
const sunAz = ['*', Math.PI / 180, ['var', 'sunAz']];
const incidence = [
'+',
['*', ['sin', sunEl], ['cos', slope]],
['*', ['cos', sunEl], ['sin', slope], ['cos', ['-', sunAz, aspect]]],
];
const scaled = ['*', 255, incidence];
export const reliefStyle: Style = {
variables: { vert: 1, sunEl: 45, sunAz: 315 },
color: ['color', scaled] as Style['color'],
};pmtiles-elevation.tsimport { ChangeDetectionStrategy, Component, signal } from '@angular/core';
import {
CoordinateComponent,
DefaultControlComponent,
DefaultInteractionComponent,
LayerTileComponent,
MapComponent,
SourceDataTileComponent,
SourceOsmComponent,
ViewComponent,
} from 'cc-openlayers';
import { LayerWebGLTileComponent } from 'cc-openlayers/webgl';
import { archiveLoader } from '../pmtiles-image/pmtiles-image.shared';
import { ELEVATION_ARCHIVE, reliefStyle, ELEVATION_CREDIT } from './pmtiles-elevation.shared';
@Component({
selector: 'app-pmtiles-elevation',
imports: [
CoordinateComponent,
DefaultControlComponent,
DefaultInteractionComponent,
LayerTileComponent,
MapComponent,
SourceDataTileComponent,
SourceOsmComponent,
ViewComponent,
LayerWebGLTileComponent,
],
templateUrl: './pmtiles-elevation.html',
changeDetection: ChangeDetectionStrategy.OnPush,
})
export class PmtilesElevation {
protected readonly loader = archiveLoader(ELEVATION_ARCHIVE);
protected readonly credit = ELEVATION_CREDIT;
protected readonly style = reliefStyle;
protected readonly variables = signal({ vert: 1, sunEl: 45, sunAz: 315 });
protected setValue(key: 'vert' | 'sunEl' | 'sunAz', event: Event) {
this.variables.update((value) => ({ ...value, [key]: Number((event.target as HTMLInputElement).value) }));
}
} The React version uses the library's React adapter, cc-openlayers/react: each component creates the OpenLayers object it names when it mounts, updates it from its props and disposes of it when it unmounts.
pmtiles-elevation.react.tsximport { useMemo, useState } from 'react';
import {
Coordinate,
DefaultControls,
DefaultInteractions,
Map,
View,
TileLayer,
OSMSource,
DataTileSource,
} from 'cc-openlayers/react';
import { WebGLTileLayer } from 'cc-openlayers/react/webgl';
import { archiveLoader } from '../pmtiles-image/pmtiles-image.shared';
import { ELEVATION_ARCHIVE, reliefStyle, ELEVATION_CREDIT } from './pmtiles-elevation.shared';
export function PmtilesElevation() {
const loader = useMemo(() => archiveLoader(ELEVATION_ARCHIVE), []);
const [variables, setVariables] = useState({ vert: 1, sunEl: 45, sunAz: 315 });
return (
<>
<Map height="480px">
<DefaultInteractions />
<DefaultControls />
<View zoom={9}>
<Coordinate x={19.9368} y={50.0614} srid="EPSG:4326" />
</View>
<TileLayer>
<OSMSource />
</TileLayer>
<WebGLTileLayer style={reliefStyle} variables={variables}>
<DataTileSource loader={loader} maxZoom={9} transition={0} attributions={ELEVATION_CREDIT} />
</WebGLTileLayer>
</Map>
<div className="example-controls">
<label>
Vertical exaggeration
<input
type="range"
min={1}
max={5}
value={variables.vert}
onChange={(event) => setVariables((value) => ({ ...value, vert: Number(event.target.value) }))}
/>
<output>{variables.vert}</output>
</label>
<label>
Sun elevation
<input
type="range"
min={5}
max={90}
value={variables.sunEl}
onChange={(event) => setVariables((value) => ({ ...value, sunEl: Number(event.target.value) }))}
/>
<output>{variables.sunEl}</output>
</label>
<label>
Sun azimuth
<input
type="range"
min={0}
max={360}
value={variables.sunAz}
onChange={(event) => setVariables((value) => ({ ...value, sunAz: Number(event.target.value) }))}
/>
<output>{variables.sunAz}</output>
</label>
</div>
</>
);
}pmtiles-elevation.shared.tsimport type { Style } from 'ol/layer/WebGLTile.js';
export const ELEVATION_ARCHIVE =
'https://pub-9288c68512ed46eca46ddcade307709b.r2.dev/protomaps-sample-datasets/terrarium_z9.pmtiles';
export const ELEVATION_CREDIT =
'Elevation: Tilezen Jörð, sources and attribution at https://github.com/tilezen/joerd/blob/master/docs/attribution.md';
function elevation(xOffset: number, yOffset: number) {
const red = ['band', 1, xOffset, yOffset];
const green = ['band', 2, xOffset, yOffset];
const blue = ['band', 3, xOffset, yOffset];
// band math operates on normalized values from 0-1
// so we scale by 255
return ['+', ['*', 255 * 256, red], ['*', 255, green], ['*', 255 / 256, blue], -32768];
}
// Generates a shaded relief image given elevation data. Uses a 3x3
// neighborhood for determining slope and aspect.
const dp = ['*', 2, ['resolution']];
const z0x = ['*', ['var', 'vert'], elevation(-1, 0)];
const z1x = ['*', ['var', 'vert'], elevation(1, 0)];
const dzdx = ['/', ['-', z1x, z0x], dp];
const z0y = ['*', ['var', 'vert'], elevation(0, -1)];
const z1y = ['*', ['var', 'vert'], elevation(0, 1)];
const dzdy = ['/', ['-', z1y, z0y], dp];
const slope = ['atan', ['sqrt', ['+', ['^', dzdx, 2], ['^', dzdy, 2]]]];
const aspect = ['clamp', ['atan', ['-', 0, dzdx], dzdy], -Math.PI, Math.PI];
const sunEl = ['*', Math.PI / 180, ['var', 'sunEl']];
const sunAz = ['*', Math.PI / 180, ['var', 'sunAz']];
const incidence = [
'+',
['*', ['sin', sunEl], ['cos', slope]],
['*', ['cos', sunEl], ['sin', slope], ['cos', ['-', sunAz, aspect]]],
];
const scaled = ['*', 255, incidence];
export const reliefStyle: Style = {
variables: { vert: 1, sunEl: 45, sunAz: 315 },
color: ['color', scaled] as Style['color'],
};How the React version works
Decode Terrarium elevation tiles from PMTiles and adjust the hillshade lighting.
What both versions share
pmtiles supplies RGB elevation tiles. WebGL decodes their heights and estimates slope from neighbouring pixels.
From Angular to React
| Angular | React |
|---|---|
| A signal object holds vertical exaggeration and the two sun angles. | useState holds the same three style variables. |
| An external Angular template declares the example. | JSX declares the example and its controls. |
| The Angular lifecycle releases the mounted resources. | Effect or subscription cleanup releases the mounted resources. |
Who creates, updates and disposes
Both versions share the PMTiles reader and hillshade expression. Variable changes reuse the WebGL layer rather than rebuilding the shader.
Architecture and OpenLayers mechanics
Shared archiveLoader streams compressed Terrarium PNG bytes per tile from the PMTiles archive into SourceDataTileComponent. Above OpenStreetMap, LayerWebGLTileComponent evaluates reliefStyle—decoding heights from RGB bands and sampling neighbouring pixels for slope and aspect—while slider edits update variables (vert, sunEl, sunAz) as GPU uniforms.
How it works
- RGB Terrarium tiles stream from a PMTiles archive while WebGL style expressions decode elevation and compute neighbour-pixel hillshade slope.
Pitfalls
- Because the bundled elevation archive stops at zoom level
9, zooming in closer overzooms level-9 terrain cells rather than adding finer DEM resolution.
Related examples
The same feature in the OpenLayers examples .
Background: state and lifecycle of maps in Angular with OpenLayers, which the components of cc-openlayers take care of.