Raster, GeoTIFF and WebGL · Angular, React and OpenLayers
Colour a raster index
Build dynamic chroma-js colour ramps for Sentinel-2 Cloud Optimized GeoTIFF band indices in OpenLayers with live min, max and colour pickers.
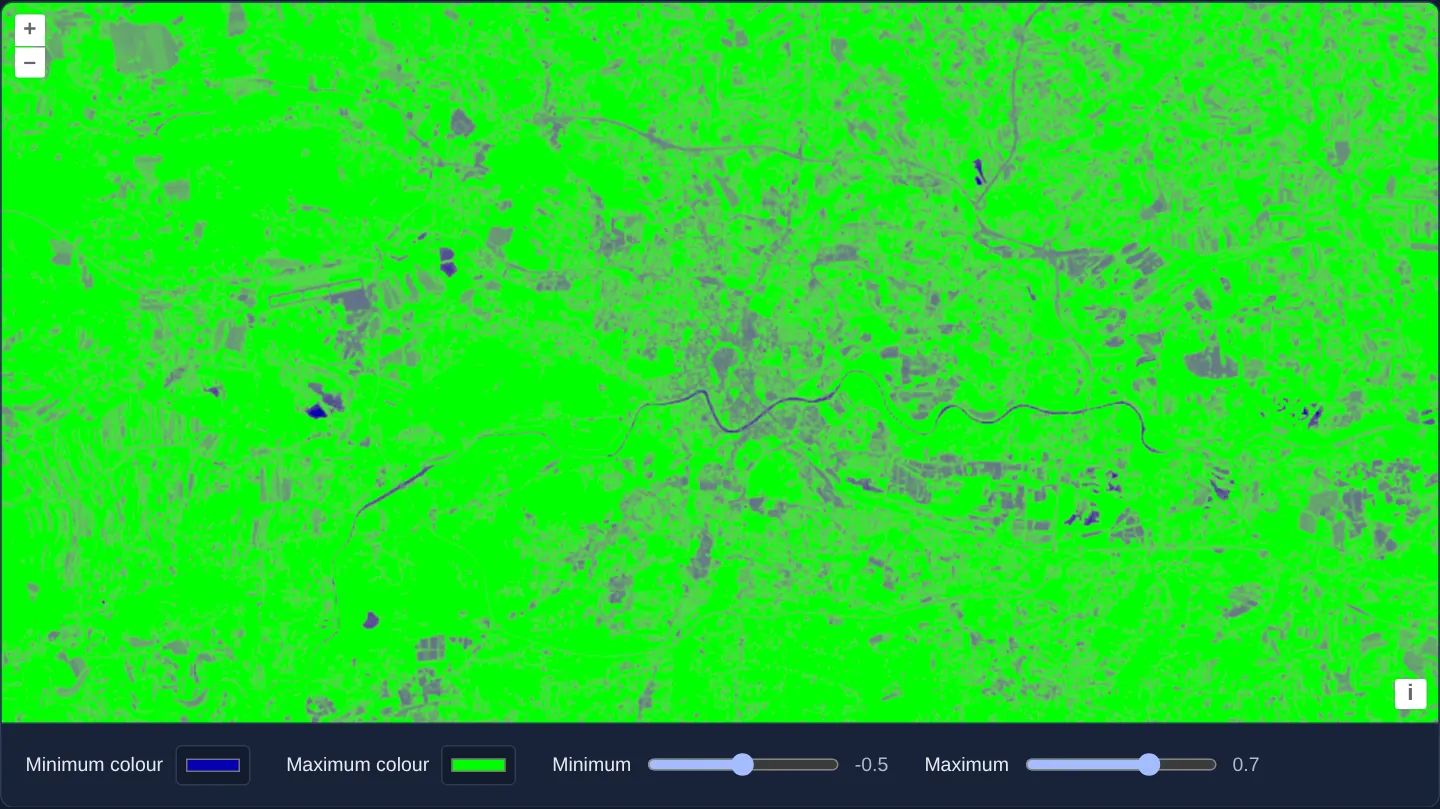
What this example shows
Over a Sentinel-2 scene of Kraków in WebGL, range sliders (minimum starting at -0.5, maximum at 0.7) and two colour pickers (low #0300ad and high #00ff00) let you reshape the spectral index colour ramp on the fly and inspect subtle vegetation or moisture variations.
When you need it
Fixed colour ramps often lack contrast within the narrow numeric range of a specific farm field, lake or season—requiring interactive min/max domain clamping and custom colour endpoints.
Generating stop colours with chroma-js and feeding threshold/colour values into WebGL style variables updates GPU rendering without reloading multi-band GeoTIFF tiles.
The code
The example uses cc-openlayers, my Angular component library for OpenLayers: each aol-… element creates the OpenLayers object it names, updates it from its inputs and disposes of it with the component.
cog-colors.html<aol-map height="480px"
><aol-interaction-default /><aol-control-defaults />
@if (view(); as options) {
<aol-view
[projection]="options.projection"
[resolutions]="options.resolutions"
[extent]="options.extent"
[center]="krakow"
[resolution]="40"
/>
}
<aol-layer-webgltile [style]="style" [variables]="variables()"
><aol-source-geotiff
[sources]="sources"
attributions="Contains modified Copernicus Sentinel data 2024"
(viewReady)="view.set($event)" /></aol-layer-webgltile
></aol-map>
<div class="example-controls">
<label>Minimum colour<input type="color" [value]="low()" (input)="change($event, 'low')" /></label
><label>Maximum colour<input type="color" [value]="high()" (input)="change($event, 'high')" /></label
><label
>Minimum<input
type="range"
min="-1"
max="0"
step="0.1"
[value]="minimum()"
(input)="change($event, 'minimum')"
/><output>{{ minimum() }}</output></label
><label
>Maximum<input
type="range"
min="0.1"
max="1"
step="0.1"
[value]="maximum()"
(input)="change($event, 'maximum')"
/><output>{{ maximum() }}</output></label
>
</div>cog-colors.shared.tsimport chroma from 'chroma-js';
import type { ExpressionValue } from 'ol/expr/expression';
import type { Style } from 'ol/layer/WebGLTile';
import { SOURCES as SCENE_SOURCES } from '../cog-style/cog-style.shared';
export { KRAKOW } from '../cog/cog.shared';
export const SOURCES = [SCENE_SOURCES[0], SCENE_SOURCES[3]].map((source) => ({ ...source, max: 10000 }));
export function colourStyle(minimum = -0.5, maximum = 0.7, low = '#0300ad', high = '#00ff00'): Style {
const ramp = chroma.scale([low, high]).mode('lab');
const variables: Record<string, number> = {};
const stops: ExpressionValue[] = [];
for (let i = 0; i <= 10; i++) {
const [red, green, blue] = ramp(i / 10).rgb();
Object.assign(variables, {
[`value${i}`]: Number((minimum + (i * (maximum - minimum)) / 10).toFixed(8)),
[`red${i}`]: red,
[`green${i}`]: green,
[`blue${i}`]: blue,
});
stops.push(['var', `value${i}`], ['color', ['var', `red${i}`], ['var', `green${i}`], ['var', `blue${i}`]]);
}
const ndvi: ExpressionValue = ['/', ['-', ['band', 2], ['band', 1]], ['+', ['band', 2], ['band', 1]]];
return { variables, color: ['interpolate', ['linear'], ndvi, ...stops] };
}cog-colors.tsimport { ChangeDetectionStrategy, Component, computed, signal } from '@angular/core';
import { DefaultControlComponent, DefaultInteractionComponent, MapComponent, ViewComponent } from 'cc-openlayers';
import { LayerWebGLTileComponent, SourceGeoTIFFComponent } from 'cc-openlayers/webgl';
import type { ViewOptions } from 'ol/View';
import { colourStyle, KRAKOW, SOURCES } from './cog-colors.shared';
@Component({
selector: 'app-cog-colors',
imports: [
DefaultControlComponent,
DefaultInteractionComponent,
MapComponent,
ViewComponent,
LayerWebGLTileComponent,
SourceGeoTIFFComponent,
],
changeDetection: ChangeDetectionStrategy.OnPush,
templateUrl: './cog-colors.html',
})
export class CogColors {
readonly view = signal<ViewOptions | undefined>(undefined);
readonly minimum = signal(-0.5);
readonly maximum = signal(0.7);
readonly low = signal('#0300ad');
readonly high = signal('#00ff00');
readonly style = colourStyle();
readonly variables = computed(() => colourStyle(this.minimum(), this.maximum(), this.low(), this.high()).variables);
readonly krakow = KRAKOW;
readonly sources = SOURCES;
change(event: Event, field: 'minimum' | 'maximum' | 'low' | 'high'): void {
const value = (event.target as HTMLInputElement).value;
if (field === 'low' || field === 'high') this[field].set(value);
else this[field].set(Number(value));
}
} The React version uses the library's React adapter, cc-openlayers/react: each component creates the OpenLayers object it names when it mounts, updates it from its props and disposes of it when it unmounts.
cog-colors.react.tsximport { useMemo, useState } from 'react';
import type { ViewOptions } from 'ol/View';
import { DefaultControls, DefaultInteractions, Map, View } from 'cc-openlayers/react';
import { GeoTIFFSource, WebGLTileLayer } from 'cc-openlayers/react/webgl';
import { colourStyle, KRAKOW, SOURCES } from './cog-colors.shared';
const STYLE = colourStyle();
export function CogColors() {
const [view, setView] = useState<ViewOptions>();
const [minimum, setMinimum] = useState(-0.5);
const [maximum, setMaximum] = useState(0.7);
const [low, setLow] = useState('#0300ad');
const [high, setHigh] = useState('#00ff00');
const variables = useMemo(() => colourStyle(minimum, maximum, low, high).variables, [minimum, maximum, low, high]);
return (
<>
<Map height="480px">
<DefaultControls />
<DefaultInteractions />
{view && (
<View
projection={view.projection}
resolutions={view.resolutions}
extent={view.extent}
center={KRAKOW}
resolution={40}
/>
)}
<WebGLTileLayer style={STYLE} variables={variables}>
<GeoTIFFSource
sources={SOURCES}
attributions="Contains modified Copernicus Sentinel data 2024"
onViewReady={setView}
/>
</WebGLTileLayer>
</Map>
<div className="example-controls">
<label>
Minimum colour
<input type="color" value={low} onChange={(e) => setLow(e.target.value)} />
</label>
<label>
Maximum colour
<input type="color" value={high} onChange={(e) => setHigh(e.target.value)} />
</label>
<label>
Minimum
<input
type="range"
min="-1"
max="0"
step="0.1"
value={minimum}
onChange={(e) => setMinimum(Number(e.target.value))}
/>
<output>{minimum}</output>
</label>
<label>
Maximum
<input
type="range"
min="0.1"
max="1"
step="0.1"
value={maximum}
onChange={(e) => setMaximum(Number(e.target.value))}
/>
<output>{maximum}</output>
</label>
</div>
</>
);
}cog-colors.shared.tsimport chroma from 'chroma-js';
import type { ExpressionValue } from 'ol/expr/expression';
import type { Style } from 'ol/layer/WebGLTile';
import { SOURCES as SCENE_SOURCES } from '../cog-style/cog-style.shared';
export { KRAKOW } from '../cog/cog.shared';
export const SOURCES = [SCENE_SOURCES[0], SCENE_SOURCES[3]].map((source) => ({ ...source, max: 10000 }));
export function colourStyle(minimum = -0.5, maximum = 0.7, low = '#0300ad', high = '#00ff00'): Style {
const ramp = chroma.scale([low, high]).mode('lab');
const variables: Record<string, number> = {};
const stops: ExpressionValue[] = [];
for (let i = 0; i <= 10; i++) {
const [red, green, blue] = ramp(i / 10).rgb();
Object.assign(variables, {
[`value${i}`]: Number((minimum + (i * (maximum - minimum)) / 10).toFixed(8)),
[`red${i}`]: red,
[`green${i}`]: green,
[`blue${i}`]: blue,
});
stops.push(['var', `value${i}`], ['color', ['var', `red${i}`], ['var', `green${i}`], ['var', `blue${i}`]]);
}
const ndvi: ExpressionValue = ['/', ['-', ['band', 2], ['band', 1]], ['+', ['band', 2], ['band', 1]]];
return { variables, color: ['interpolate', ['linear'], ndvi, ...stops] };
}How the React version works
Build a colour ramp for a Sentinel-2 band calculation over Kraków.
What both versions share
chroma-js creates the palette; OpenLayers evaluates the band expression over the scene tiles.
From Angular to React
| Angular | React |
|---|---|
| Colour input signals compute style variables. | useState supplies the colour input values and derived variables. |
| An external Angular template declares the example. | JSX declares the example and its controls. |
| The Angular lifecycle releases the mounted resources. | Effect or subscription cleanup releases the mounted resources. |
Who creates, updates and disposes
Both versions keep the shader style stable and change only the ramp variables. The framework adapters own the layer and raster source.
Architecture and OpenLayers mechanics
Helper colourStyle constructs a parameterised WebGL Style evaluating the normalized band index across stop variables generated with chroma-js. Editing minimum, maximum, low or high recomputes the variables signal passed to LayerWebGLTileComponent, updating shader uniforms instantaneously.
How it works
- Palettes generated by chroma-js combine with OpenLayers WebGL band expressions and reactive style variables over Sentinel-2 COG tiles.
Pitfalls
- Adjusting colour stops and domain limits changes visual emphasis only, never underlying reflectance measurements—always account for cloud cover and no-data pixels when interpreting stretched indices.
Related examples
The same feature in the OpenLayers examples .
Background: state and lifecycle of maps in Angular with OpenLayers, which the components of cc-openlayers take care of.