Vector data · Angular, React and OpenLayers
Draw district boundaries with D3
Render TopoJSON district boundaries as a custom D3-projected SVG layer synchronized with OpenLayers pan, zoom and rotation in Angular and React.
What this example shows
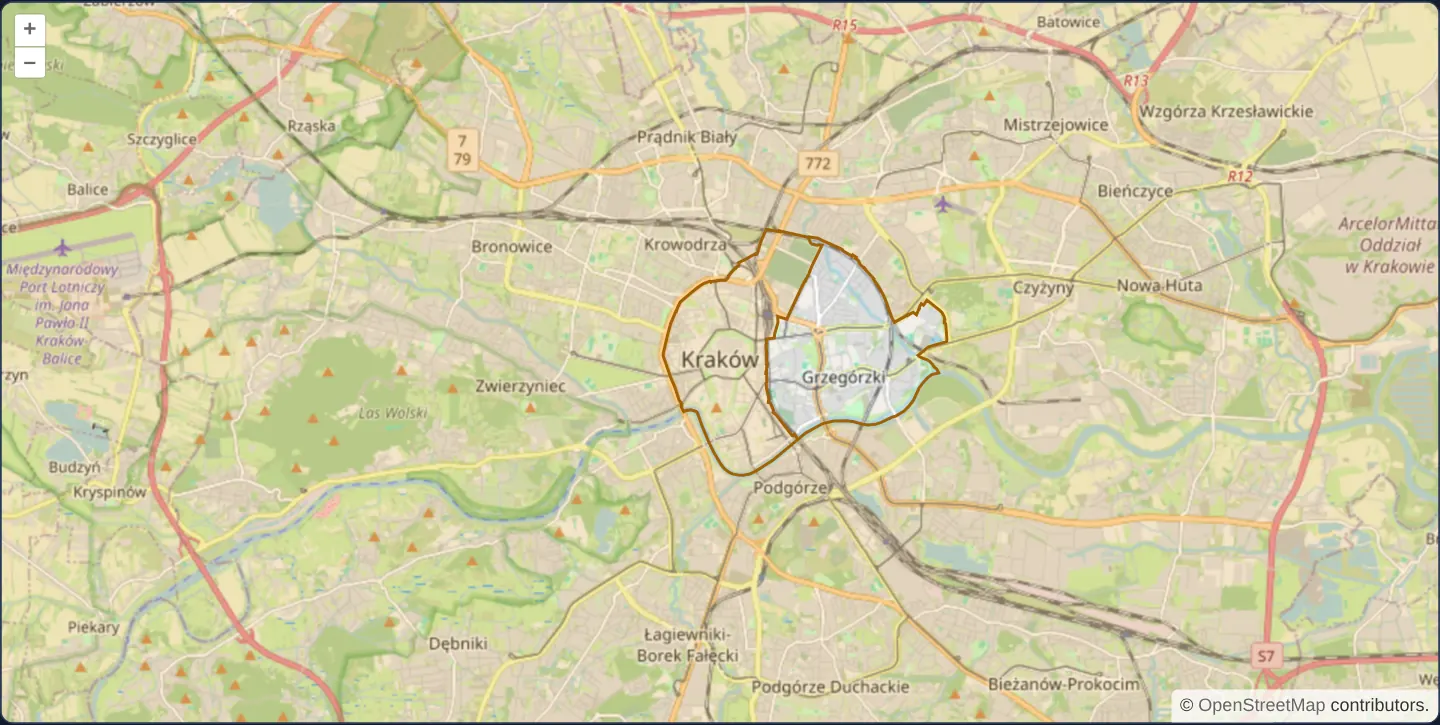
Over OpenStreetMap of Kraków, local TopoJSON district boundaries are decoded with topojson-client and rendered as crisp SVG paths by D3’s geo-path generator—staying locked to the underlying streets as you pan, zoom and rotate the OpenLayers viewport.
When you need it
Data-visualisation teams with rich existing D3 SVG cartography—animated transitions, custom SVG filters, Voronoi overlays or bespoke choropleths—often want to mount those D3 drawings over slippy OpenLayers basemaps.
Re-evaluating D3’s path projection from OpenLayers’ live frame state keeps SVG elements geographically registered at every scale and heading.
The code
The example uses cc-openlayers, my Angular component library for OpenLayers: each aol-… element creates the OpenLayers object it names, updates it from its inputs and disposes of it with the component.
d3.html<aol-map height="480px"
><aol-interaction-default /><aol-control-defaults /><aol-view [zoom]="12"
><aol-coordinate [x]="19.9368" [y]="50.0614" srid="EPSG:4326" /></aol-view
><aol-layer-tile><aol-source-osm /></aol-layer-tile
></aol-map>
@if (error()) {
<p role="alert">{{ error() }}</p>
}d3.shared.tsimport { json } from 'd3-fetch';
import { geoMercator, geoPath } from 'd3-geo';
import { select } from 'd3-selection';
import { feature } from 'topojson-client';
import type { Topology } from 'topojson-specification';
import type { FeatureCollection } from 'geojson';
import type Map from 'ol/Map';
import type { FrameState } from 'ol/Map';
import Layer from 'ol/layer/Layer';
import { toLonLat } from 'ol/proj';
export function drawDistricts(features: FeatureCollection, frame: FrameState): SVGSVGElement {
const [width, height] = frame.size;
const center = toLonLat(frame.viewState.center, frame.viewState.projection);
const projection = geoMercator()
.scale(6378137 / frame.viewState.resolution)
.center([center[0], center[1]])
.translate([width / 2, height / 2])
.angle((-frame.viewState.rotation * 180) / Math.PI);
const element = document.createElementNS('http://www.w3.org/2000/svg', 'svg');
const svg = select(element)
.attr('width', width)
.attr('height', height)
.style('position', 'absolute')
.style('pointer-events', 'none');
svg
.append('path')
.datum(features)
.attr('d', geoPath(projection))
.attr('fill', 'rgba(245,158,11,0.15)')
.attr('stroke', '#a16207')
.attr('stroke-width', 2);
return element;
}
export function bind(map: Map, onError: (message: string) => void = () => undefined): () => void {
const controller = new AbortController();
let layer: Layer | undefined;
void json<Topology>('assets/drag-and-drop/districts.topojson', { signal: controller.signal })
.then((topology) => {
if (!topology || controller.signal.aborted) return;
const districts = feature(topology, topology.objects['districts']) as FeatureCollection;
layer = new Layer({
render: (frame) => {
const container = document.createElement('div');
container.style.pointerEvents = 'none';
container.append(drawDistricts(districts, frame));
return container;
},
});
map.addLayer(layer);
})
.catch(() => {
if (!controller.signal.aborted) onError('District data could not be loaded.');
});
return () => {
controller.abort();
if (layer) map.removeLayer(layer);
};
}d3.tsimport {
ChangeDetectionStrategy,
Component,
DestroyRef,
inject,
signal,
viewChild,
type AfterViewInit,
} from '@angular/core';
import {
MapComponent,
ViewComponent,
CoordinateComponent,
DefaultControlComponent,
DefaultInteractionComponent,
LayerTileComponent,
SourceOsmComponent,
} from 'cc-openlayers';
import { bind } from './d3.shared';
@Component({
selector: 'app-d3',
imports: [
MapComponent,
ViewComponent,
CoordinateComponent,
DefaultControlComponent,
DefaultInteractionComponent,
LayerTileComponent,
SourceOsmComponent,
],
changeDetection: ChangeDetectionStrategy.OnPush,
templateUrl: './d3.html',
})
export class D3 implements AfterViewInit {
readonly error = signal('');
private readonly map = viewChild.required(MapComponent);
private readonly destroy = inject(DestroyRef);
ngAfterViewInit(): void {
this.destroy.onDestroy(bind(this.map().instance, (message) => this.error.set(message)));
}
} The React version uses the library's React adapter, cc-openlayers/react: each component creates the OpenLayers object it names when it mounts, updates it from its props and disposes of it when it unmounts.
d3.react.tsximport { useEffect, useState } from 'react';
import {
Map,
View,
Coordinate,
DefaultControls,
DefaultInteractions,
TileLayer,
OSMSource,
useMap,
} from 'cc-openlayers/react';
import { bind } from './d3.shared';
export function D3() {
const [error, setError] = useState('');
return (
<>
<Map height="480px">
<DefaultControls />
<DefaultInteractions />
<View zoom={12}>
<Coordinate x={19.9368} y={50.0614} srid="EPSG:4326" />
</View>
<TileLayer>
<OSMSource />
</TileLayer>
<PackageLayer onError={setError} />
</Map>
{error && <p role="alert">{error}</p>}
</>
);
}
function PackageLayer({ onError }: { onError: (message: string) => void }) {
const map = useMap();
useEffect(() => bind(map, onError), [map, onError]);
return null;
}d3.shared.tsimport { json } from 'd3-fetch';
import { geoMercator, geoPath } from 'd3-geo';
import { select } from 'd3-selection';
import { feature } from 'topojson-client';
import type { Topology } from 'topojson-specification';
import type { FeatureCollection } from 'geojson';
import type Map from 'ol/Map';
import type { FrameState } from 'ol/Map';
import Layer from 'ol/layer/Layer';
import { toLonLat } from 'ol/proj';
export function drawDistricts(features: FeatureCollection, frame: FrameState): SVGSVGElement {
const [width, height] = frame.size;
const center = toLonLat(frame.viewState.center, frame.viewState.projection);
const projection = geoMercator()
.scale(6378137 / frame.viewState.resolution)
.center([center[0], center[1]])
.translate([width / 2, height / 2])
.angle((-frame.viewState.rotation * 180) / Math.PI);
const element = document.createElementNS('http://www.w3.org/2000/svg', 'svg');
const svg = select(element)
.attr('width', width)
.attr('height', height)
.style('position', 'absolute')
.style('pointer-events', 'none');
svg
.append('path')
.datum(features)
.attr('d', geoPath(projection))
.attr('fill', 'rgba(245,158,11,0.15)')
.attr('stroke', '#a16207')
.attr('stroke-width', 2);
return element;
}
export function bind(map: Map, onError: (message: string) => void = () => undefined): () => void {
const controller = new AbortController();
let layer: Layer | undefined;
void json<Topology>('assets/drag-and-drop/districts.topojson', { signal: controller.signal })
.then((topology) => {
if (!topology || controller.signal.aborted) return;
const districts = feature(topology, topology.objects['districts']) as FeatureCollection;
layer = new Layer({
render: (frame) => {
const container = document.createElement('div');
container.style.pointerEvents = 'none';
container.append(drawDistricts(districts, frame));
return container;
},
});
map.addLayer(layer);
})
.catch(() => {
if (!controller.signal.aborted) onError('District data could not be loaded.');
});
return () => {
controller.abort();
if (layer) map.removeLayer(layer);
};
}How the React version works
Render local district boundaries as an SVG layer using D3 and TopoJSON.
What both versions share
topojson-client reads the local topology; D3 projects its geometry into the current map frame.
From Angular to React
| Angular | React |
|---|---|
| ngAfterViewInit installs the SVG layer; DestroyRef removes it. | A child component reads useMap and an effect installs and removes the layer. |
| An external Angular template declares the example. | JSX declares the example and its controls. |
| The Angular lifecycle releases the mounted resources. | Effect or subscription cleanup releases the mounted resources. |
Who creates, updates and disposes
Both versions share the district loader and D3 projection. Cleanup aborts an unfinished request and removes the custom layer.
Architecture and OpenLayers mechanics
Helper bind parses the local topology via topojson-client and mounts a custom OpenLayers layer render function that updates D3’s geographic path projection to match the active frame’s centre, resolution, pixel size and rotation, cleaning up DOM nodes and listeners via DestroyRef on unmount.
How it works
- Local topology arcs decode through topojson-client while D3 projects SVG path geometry into the active OpenLayers map frame.
Pitfalls
- Never position a D3 <svg> as a static screen overlay computed only once on mount—recompute or transform paths against current OpenLayers resolution, extent and rotation so features never drift during pans or zooms.
Related examples
The same feature in the OpenLayers examples .
Background: state and lifecycle of maps in Angular with OpenLayers, which the components of cc-openlayers take care of.