Tile and image services · Angular, React and OpenLayers
Tiles made in the browser from pixel data
Generate procedural RGBA pixel-array tiles in the browser with OpenLayers DataTileSource and render them on the GPU via WebGLTileLayer.
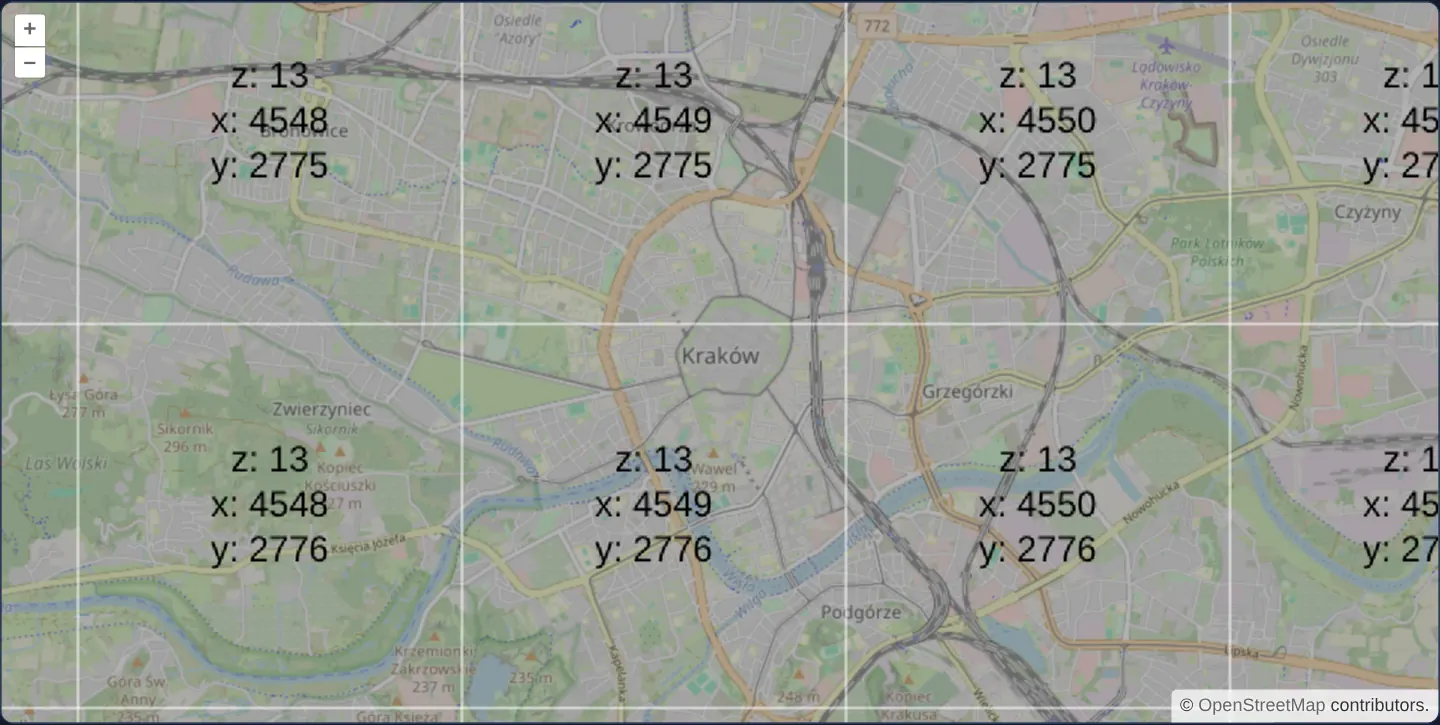
What this example shows
Over central Kraków at zoom 13, translucent grey 256 × 256 tiles outlined in white and stamped with their z / x / y coordinates are synthesised in memory as typed pixel arrays and composited over OpenStreetMap by WebGL.
When you need it
Scientific and environmental WebGIS apps frequently compute or decode gridded rasters client-side—such as NetCDF weather slices, custom binary elevation grids, hydrological simulation outputs or WebWorker-generated heat surfaces—rather than fetching pre-rendered PNGs.
DataTileSource lets a JavaScript or WebAssembly [loader] return raw numeric band arrays per (z, x, y) tile and delegates pyramid caching, frustum culling and GPU texture upload to OpenLayers.
The code
The example uses cc-openlayers, my Angular component library for OpenLayers: each aol-… element creates the OpenLayers object it names, updates it from its inputs and disposes of it with the component.
data-tiles.tsimport { ChangeDetectionStrategy, Component } from '@angular/core';
import {
CoordinateComponent,
DefaultControlComponent,
DefaultInteractionComponent,
LayerTileComponent,
MapComponent,
SourceDataTileComponent,
SourceOsmComponent,
ViewComponent,
} from 'cc-openlayers';
import { LayerWebGLTileComponent } from 'cc-openlayers/webgl';
const SIZE = 256;
const LINE_HEIGHT = 30;
/**
* Tiles whose pixels a data tile source takes from a loader (here a canvas labelled with each tile's coordinates),
* drawn over a street map by a WebGL tile layer: the canvas tile layer cannot draw pixel arrays.
*/
@Component({
selector: 'app-data-tiles',
imports: [
CoordinateComponent,
DefaultControlComponent,
DefaultInteractionComponent,
LayerTileComponent,
LayerWebGLTileComponent,
MapComponent,
SourceDataTileComponent,
SourceOsmComponent,
ViewComponent,
],
changeDetection: ChangeDetectionStrategy.OnPush,
template: `
<aol-map height="480px">
<aol-interaction-default />
<aol-control-defaults />
<aol-view [zoom]="13">
<aol-coordinate [x]="19.9368" [y]="50.0614" srid="EPSG:4326" />
</aol-view>
<aol-layer-tile><aol-source-osm /></aol-layer-tile>
<aol-layer-webgltile>
<!-- No opacity transition, so labels of loading tiles do not overlap. -->
<aol-source-datatile [loader]="loader" [transition]="0" />
</aol-layer-webgltile>
</aol-map>
`,
})
export class DataTiles {
private context?: CanvasRenderingContext2D | null;
/** Draws the tile's coordinates on the shared canvas and gives its pixels. */
protected readonly loader = (z: number, x: number, y: number): Uint8ClampedArray => {
const context = (this.context ??= labelCanvas());
if (!context) return new Uint8ClampedArray(SIZE * SIZE * 4);
const half = SIZE / 2;
context.clearRect(0, 0, SIZE, SIZE);
context.fillStyle = 'rgba(100, 100, 100, 0.5)';
context.fillRect(0, 0, SIZE, SIZE);
context.fillStyle = 'black';
context.fillText(`z: ${z}`, half, half - LINE_HEIGHT);
context.fillText(`x: ${x}`, half, half);
context.fillText(`y: ${y}`, half, half + LINE_HEIGHT);
context.strokeRect(0, 0, SIZE, SIZE);
return context.getImageData(0, 0, SIZE, SIZE).data;
};
}
/** A tile-sized canvas set up for centred labels and a white outline of the tile. */
function labelCanvas(): CanvasRenderingContext2D | null {
const canvas = document.createElement('canvas');
canvas.width = SIZE;
canvas.height = SIZE;
const context = canvas.getContext('2d', { willReadFrequently: true });
if (context) {
context.strokeStyle = 'white';
context.textAlign = 'center';
context.font = '24px sans-serif';
}
return context;
} The React version uses the library's React adapter, cc-openlayers/react: each component creates the OpenLayers object it names when it mounts, updates it from its props and disposes of it when it unmounts.
data-tiles.react.tsximport { useCallback, useRef } from 'react';
import {
Coordinate,
DataTileSource,
DefaultControls,
DefaultInteractions,
Map,
OSMSource,
TileLayer,
View,
} from 'cc-openlayers/react';
import { WebGLTileLayer } from 'cc-openlayers/react/webgl';
const SIZE = 256;
const LINE_HEIGHT = 30;
/**
* Tiles whose pixels a data tile source takes from a loader (here a canvas labelled with each tile's coordinates),
* drawn over a street map by a WebGL tile layer: the canvas tile layer cannot draw pixel arrays.
*/
export function DataTiles() {
const context = useRef<CanvasRenderingContext2D | null | undefined>(undefined);
/** Draws the tile's coordinates on the shared canvas and gives its pixels. */
const loader = useCallback((z: number, x: number, y: number): Uint8ClampedArray => {
const canvas = (context.current ??= labelCanvas());
if (!canvas) return new Uint8ClampedArray(SIZE * SIZE * 4);
const half = SIZE / 2;
canvas.clearRect(0, 0, SIZE, SIZE);
canvas.fillStyle = 'rgba(100, 100, 100, 0.5)';
canvas.fillRect(0, 0, SIZE, SIZE);
canvas.fillStyle = 'black';
canvas.fillText(`z: ${z}`, half, half - LINE_HEIGHT);
canvas.fillText(`x: ${x}`, half, half);
canvas.fillText(`y: ${y}`, half, half + LINE_HEIGHT);
canvas.strokeRect(0, 0, SIZE, SIZE);
return canvas.getImageData(0, 0, SIZE, SIZE).data;
}, []);
return (
<Map height="480px">
<DefaultInteractions />
<DefaultControls />
<View zoom={13}>
<Coordinate x={19.9368} y={50.0614} srid="EPSG:4326" />
</View>
<TileLayer>
<OSMSource />
</TileLayer>
<WebGLTileLayer>
{/* No opacity transition, so labels of loading tiles do not overlap. */}
<DataTileSource loader={loader} transition={0} />
</WebGLTileLayer>
</Map>
);
}
/** A tile-sized canvas set up for centred labels and a white outline of the tile. */
function labelCanvas(): CanvasRenderingContext2D | null {
const canvas = document.createElement('canvas');
canvas.width = SIZE;
canvas.height = SIZE;
const context = canvas.getContext('2d', { willReadFrequently: true });
if (context) {
context.strokeStyle = 'white';
context.textAlign = 'center';
context.font = '24px sans-serif';
}
return context;
}How the React version works
A DataTile source fetches nothing: its loader draws the tile coordinates on a canvas and returns the pixels, and a WebGL layer shows them over the street map.
What both versions share
OpenLayers renders the map and handles the interactions; the cc-openlayers/core layer gives both adapters the same view binding (MapViewBinding) and the same conversion of coordinates from EPSG:4326 to the map's projection. One canvas serves all tiles, as in Angular.
From Angular to React
| Angular | React |
|---|---|
<aol-source-datatile [loader]> | <DataTileSource loader={loader}> with useCallback(…, []), so the function stays the same |
| a class field with the canvas context | useRef with the context created for the first tile |
Who creates, updates and disposes
Map creates the ol/Map in useLayoutEffect and disposes of it on unmount; each layer, source and interaction component adds its object to the parent it gets from context and removes it in its effect's cleanup, as ngOnDestroy does in Angular.
Architecture and OpenLayers mechanics
aol-source-datatile invokes its [loader] function for each visible (z, x, y) coordinate on OpenStreetMap’s grid, expecting a flat typed pixel buffer containing 256 × 256 × 4 RGBA bytes. Here one reusable off-screen HTML5 canvas paints the translucent fill, border and coordinate label and extracts a fresh Uint8ClampedArray snapshot via getImageData, then is cleared and reused for the next tile.
Setting [transition] to 0 displays generated tiles immediately without overlapping labels during fades, and aol-layer-webgltile uploads the raw 4-band pixel buffers directly as GPU textures.
How it works
aol-source-datatilecalls[loader]with (z, x, y) and accepts flat 4-band RGBA typed arrays per tile.- A single shared scratch canvas draws the outline and text label, returning an independent pixel copy via
getImageDatafor each tile. - Matching OpenStreetMap’s default Web Mercator grid keeps every generated coordinate label aligned with the street tile below.
[transition]of0prevents incoming tile labels from briefly overlapping coarser parent labels during zoom changes.
Pitfalls
- Standard 2D
aol-layer-tile(CanvasTileLayer) cannot render raw numeric pixel arrays and throws an error—always pair numeric DataTile loaders withaol-layer-webgltile. - OpenLayers infers band count from array length: for default 4-band RGBA rendering on a 256 × 256 grid, the returned buffer must contain exactly 262,144 (256 * 256 * 4) values.
Related examples
The same feature in the OpenLayers examples .
Background: state and lifecycle of maps in Angular with OpenLayers, which the components of cc-openlayers take care of.