Layers · Angular, React and OpenLayers
Show the tile grid and its coordinates
Overlay a browser-rendered OpenLayers TileDebug wireframe showing z, x and y XYZ tile coordinates directly over OpenStreetMap in Angular.
What this example shows
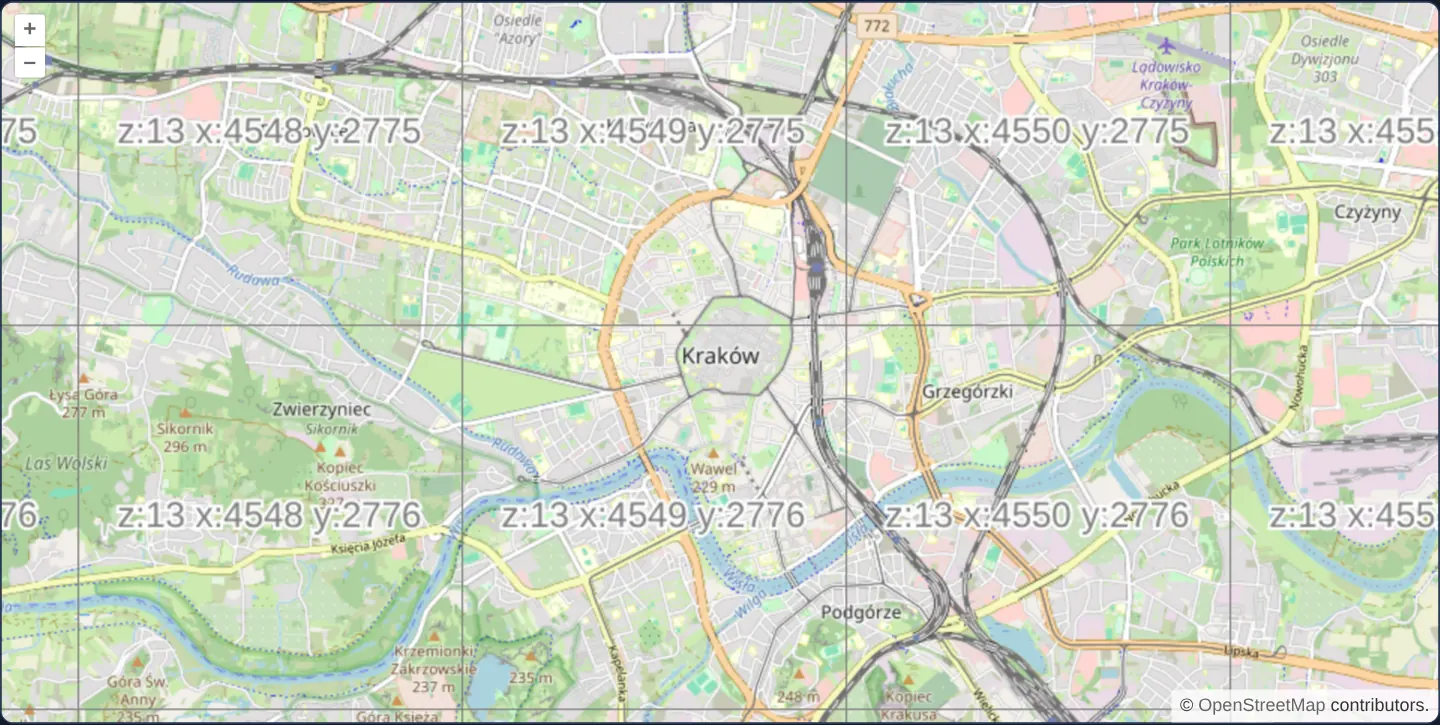
At zoom 13 over central Kraków, a crisp debug overlay outlines every 256 × 256 tile boundary in grey and prints its exact XYZ address—such as z:13 x:4549 y:2776 right over the Main Square—directly on top of the OpenStreetMap street map.
Panning or zooming draws the wireframe labels instantaneously in the browser with zero network requests or fade delay.
When you need it
Whenever a custom XYZ, WMTS or vector-tile backend returns missing squares, shifted imagery or cache misses, the very first debugging step is identifying the exact z / x / y tile coordinates OpenLayers is requesting for the current viewport.
Rendering a live TileDebug layer over the map lets developers read tile indices visually on screen instead of hunting through dozens of scrolling URLs in browser DevTools.
The code
The example uses cc-openlayers, my Angular component library for OpenLayers: each aol-… element creates the OpenLayers object it names, updates it from its inputs and disposes of it with the component.
canvas-tiles.tsimport { ChangeDetectionStrategy, Component } from '@angular/core';
import {
CoordinateComponent,
DefaultControlComponent,
DefaultInteractionComponent,
LayerTileComponent,
MapComponent,
SourceOsmComponent,
SourceTileDebugComponent,
ViewComponent,
} from 'cc-openlayers';
/** The outline and the coordinates of every tile drawn over OpenStreetMap by a tile debug source. */
@Component({
selector: 'app-canvas-tiles',
imports: [
CoordinateComponent,
DefaultControlComponent,
DefaultInteractionComponent,
LayerTileComponent,
MapComponent,
SourceOsmComponent,
SourceTileDebugComponent,
ViewComponent,
],
changeDetection: ChangeDetectionStrategy.OnPush,
template: `
<aol-map height="480px">
<aol-interaction-default />
<aol-control-defaults />
<aol-view [zoom]="13">
<aol-coordinate [x]="19.9368" [y]="50.0614" srid="EPSG:4326" />
</aol-view>
<aol-layer-tile><aol-source-osm /></aol-layer-tile>
<aol-layer-tile><aol-source-tiledebug /></aol-layer-tile>
</aol-map>
`,
})
export class CanvasTiles {} The React version uses the library's React adapter, cc-openlayers/react: each component creates the OpenLayers object it names when it mounts, updates it from its props and disposes of it when it unmounts.
canvas-tiles.react.tsximport {
Coordinate,
DefaultControls,
DefaultInteractions,
Map,
OSMSource,
TileDebugSource,
TileLayer,
View,
} from 'cc-openlayers/react';
/** The outline and the coordinates of every tile drawn over OpenStreetMap by a tile debug source. */
export function CanvasTiles() {
return (
<Map height="480px">
<DefaultInteractions />
<DefaultControls />
<View zoom={13}>
<Coordinate x={19.9368} y={50.0614} srid="EPSG:4326" />
</View>
<TileLayer>
<OSMSource />
</TileLayer>
<TileLayer>
<TileDebugSource />
</TileLayer>
</Map>
);
}How the React version works
A TileDebug source draws the outline and coordinates of each tile over OpenStreetMap. The example has no state.
What both versions share
OpenLayers renders the map and handles the interactions; the cc-openlayers/core layer gives both adapters the same view binding (MapViewBinding) and the same conversion of coordinates from EPSG:4326 to the map's projection.
From Angular to React
| Angular | React |
|---|---|
<aol-source-tiledebug /> | <TileDebugSource /> |
Who creates, updates and disposes
Map creates the ol/Map in useLayoutEffect and disposes of it on unmount; each layer, source and interaction component adds its object to the parent it gets from context and removes it in its effect's cleanup, as ngOnDestroy does in Angular.
Architecture and OpenLayers mechanics
Mounting aol-source-tiledebug inside a tile layer above OpenStreetMap synthesises 256-pixel HTML5 canvas tiles on the fly in memory—stroking the top and left cell borders and centring the z, x and north-origin y text.
With no custom grid passed in, aol-source-tiledebug adopts the default global Web Mercator XYZ pyramid of the view projection—the exact same grid OpenStreetMap uses—so every printed coordinate names the street tile directly beneath it.
How it works
aol-source-tiledebuggenerates wireframe borders and centred z / x / y text labels procedurally on browser canvases with zero HTTP traffic.- Defaulting to the view projection’s standard Web Mercator XYZ grid ensures every debug cell aligns 1:1 with north-origin OpenStreetMap tiles.
- Because debug tiles generate synchronously in memory with no fade transition, grid outlines appear on the very first frame of every pan or zoom.
Pitfalls
- A default TileDebug source always labels the standard Web Mercator XYZ grid: when debugging a WMTS, custom-origin XYZ or TMS layer, pass that layer’s exact tileGrid (or source) into TileDebug so the wireframe matches what the service actually requests.
- At fractional zoom levels, default vector-tile sources select tiles using zDirection: 1 (next finer level) whereas raster sources round differently—configure matching zDirection when debugging vector tiles.
Related examples
The same feature in the OpenLayers examples .
Background: state and lifecycle of maps in Angular with OpenLayers, which the components of cc-openlayers take care of.