Controls · Angular, React and OpenLayers
A graticule with labels
Overlay a toggleable OpenLayers coordinate graticule with degree-and-minute labels and custom dotted orange strokes over a Web Mercator map.
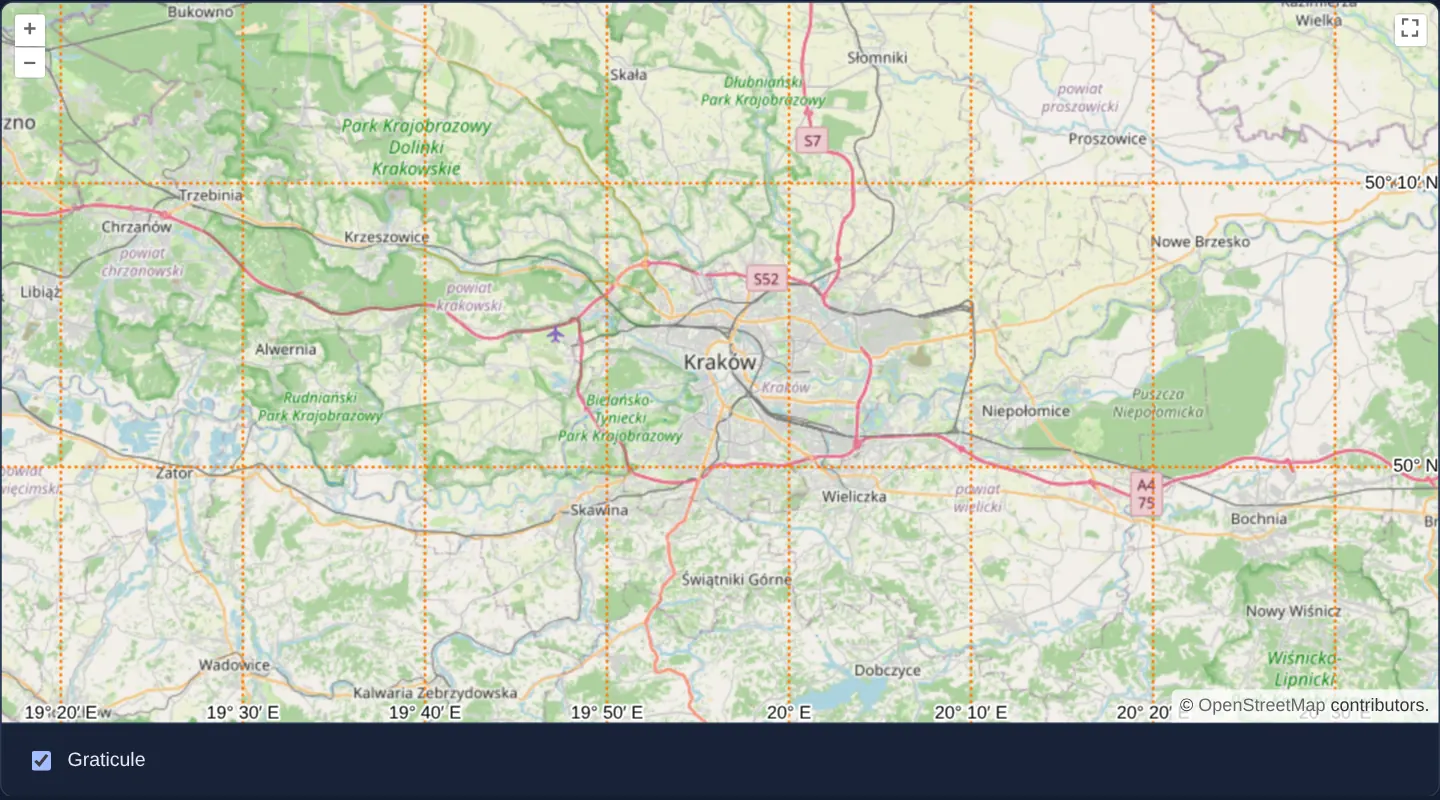
What this example shows
Over Kraków and its surrounding Małopolska towns, a dotted orange latitude-and-longitude grid (aol-graticule) automatically subdivides into clean 10-minute intervals with degree-and-minute coordinate labels along the viewport edges.
Zooming in or out adapts meridian and parallel spacing dynamically to the current scale, and a checkbox beneath the map mounts or removes the entire graticule layer cleanly.
When you need it
Topographic reference maps, maritime and aviation planning screens, surveying tools and print layouts require a labelled geographic coordinate grid so readers can estimate longitude and latitude visually across the whole canvas.
OpenLayers’ Graticule layer generates and labels meridians and parallels dynamically on the client with zero external vector datasets or tile servers.
The code
The example uses cc-openlayers, my Angular component library for OpenLayers: each aol-… element creates the OpenLayers object it names, updates it from its inputs and disposes of it with the component.
graticule.tsimport { ChangeDetectionStrategy, Component, signal } from '@angular/core';
import Stroke from 'ol/style/Stroke';
import {
ControlFullScreenComponent,
CoordinateComponent,
DefaultControlComponent,
DefaultInteractionComponent,
LayerTileComponent,
MapComponent,
SourceOsmComponent,
ViewComponent,
} from 'cc-openlayers';
import { GraticuleComponent } from 'cc-openlayers/graticule';
/** A labelled graticule of meridians and parallels drawn over the map, shown and hidden with a checkbox. */
@Component({
selector: 'app-graticule',
imports: [
ControlFullScreenComponent,
CoordinateComponent,
DefaultControlComponent,
DefaultInteractionComponent,
GraticuleComponent,
LayerTileComponent,
MapComponent,
SourceOsmComponent,
ViewComponent,
],
changeDetection: ChangeDetectionStrategy.OnPush,
template: `
<aol-map height="480px">
<aol-interaction-default />
<aol-control-defaults />
<aol-control-fullscreen />
<aol-view [zoom]="10"><aol-coordinate [x]="19.9368" [y]="50.0614" srid="EPSG:4326" /></aol-view>
<aol-layer-tile><aol-source-osm /></aol-layer-tile>
@if (shown()) {
<aol-graticule [strokeStyle]="stroke" [showLabels]="true" />
}
</aol-map>
<div class="example-controls">
<label><input type="checkbox" [checked]="shown()" (change)="toggle($event)" /> Graticule</label>
</div>
`,
})
export class Graticule {
readonly shown = signal(true);
protected readonly stroke = new Stroke({ color: 'rgba(255,120,0,0.9)', width: 2, lineDash: [0.5, 4] });
protected toggle(event: Event): void {
this.shown.set((event.target as HTMLInputElement).checked);
}
} The React version uses the library's React adapter, cc-openlayers/react: each component creates the OpenLayers object it names when it mounts, updates it from its props and disposes of it when it unmounts.
graticule.react.tsximport { useState } from 'react';
import Stroke from 'ol/style/Stroke.js';
import {
Coordinate,
DefaultControls,
DefaultInteractions,
FullScreenControl,
Map,
OSMSource,
TileLayer,
View,
} from 'cc-openlayers/react';
import { Graticule as GraticuleLayer } from 'cc-openlayers/react/graticule';
const stroke = new Stroke({ color: 'rgba(255,120,0,0.9)', width: 2, lineDash: [0.5, 4] });
/** A labelled graticule of meridians and parallels drawn over the map, shown and hidden with a checkbox. */
export function Graticule() {
const [shown, setShown] = useState(true);
return (
<>
<Map height="480px">
<DefaultInteractions />
<DefaultControls />
<FullScreenControl />
<View zoom={10}>
<Coordinate x={19.9368} y={50.0614} srid="EPSG:4326" />
</View>
<TileLayer>
<OSMSource />
</TileLayer>
{shown && <GraticuleLayer strokeStyle={stroke} showLabels />}
</Map>
<div className="example-controls">
<label>
<input type="checkbox" checked={shown} onChange={(event) => setShown(event.target.checked)} /> Graticule
</label>
</div>
</>
);
}How the React version works
A labelled geographic grid over the map; a checkbox shows and hides it.
What both versions share
OpenLayers renders the map and handles the interactions; the cc-openlayers/core layer gives both adapters the same view binding (MapViewBinding) and the same conversion of coordinates from EPSG:4326 to the map's projection. ol/layer/Graticule draws the grid as an unmanaged layer.
From Angular to React
| Angular | React |
|---|---|
@if (shown()) around <aol-graticule> | {shown && <GraticuleLayer … />} (imported from cc-openlayers/react/graticule under an alias, because the name belongs to the example) |
[strokeStyle] from a class field | the module constant stroke |
Who creates, updates and disposes
Map creates the ol/Map in useLayoutEffect and disposes of it on unmount; each layer, source and interaction component adds its object to the parent it gets from context and removes it in its effect's cleanup, as ngOnDestroy does in Angular. Unmounting the graticule layer calls its setMap(null).
Architecture and OpenLayers mechanics
aol-graticule from cc-openlayers/graticule mounts OpenLayers’ Graticule layer with [showLabels] enabled so edge ticks display formatted degrees and minutes. Passing a custom OpenLayers Stroke to [strokeStyle]—2 pixels wide in orange with a lineDash of half-pixel dashes, four-pixel gaps and round caps—renders crisp circular dots along every meridian and parallel.
Wrapping the element in @if bound to a checkbox signal attaches and disposes of the graticule layer cleanly on demand.
How it works
aol-graticulefromcc-openlayers/graticuledraws a dynamic longitude/latitude grid with edge coordinate labels enabled via[showLabels].[strokeStyle]applies a 2-pixel orange OpenLayersStrokewhoselineDashand round line caps turn short dashes into crisp dots.- A signal-driven
@ifblock adds and removes the graticule layer reactively when the checkbox toggles.
Pitfalls
- Edge degree labels compete for corner space on very compact maps—verify label placement against zoom controls and attribution bars on narrow mobile viewports.
- On a Web Mercator map, parallels of latitude spread progressively farther apart toward the poles; that visual spacing reflects conformal Mercator math rather than uneven graticule intervals.
Related examples
The same feature in the OpenLayers examples .
Background: state and lifecycle of maps in Angular with OpenLayers, which the components of cc-openlayers take care of.