Raster, GeoTIFF and WebGL · Angular, React and OpenLayers
A heatmap of transit routes
Visualize 371 Kraków tram and bus LineString routes as a corridor-density OpenLayers Heatmap filtered dynamically by vehicle type variables.
What this example shows
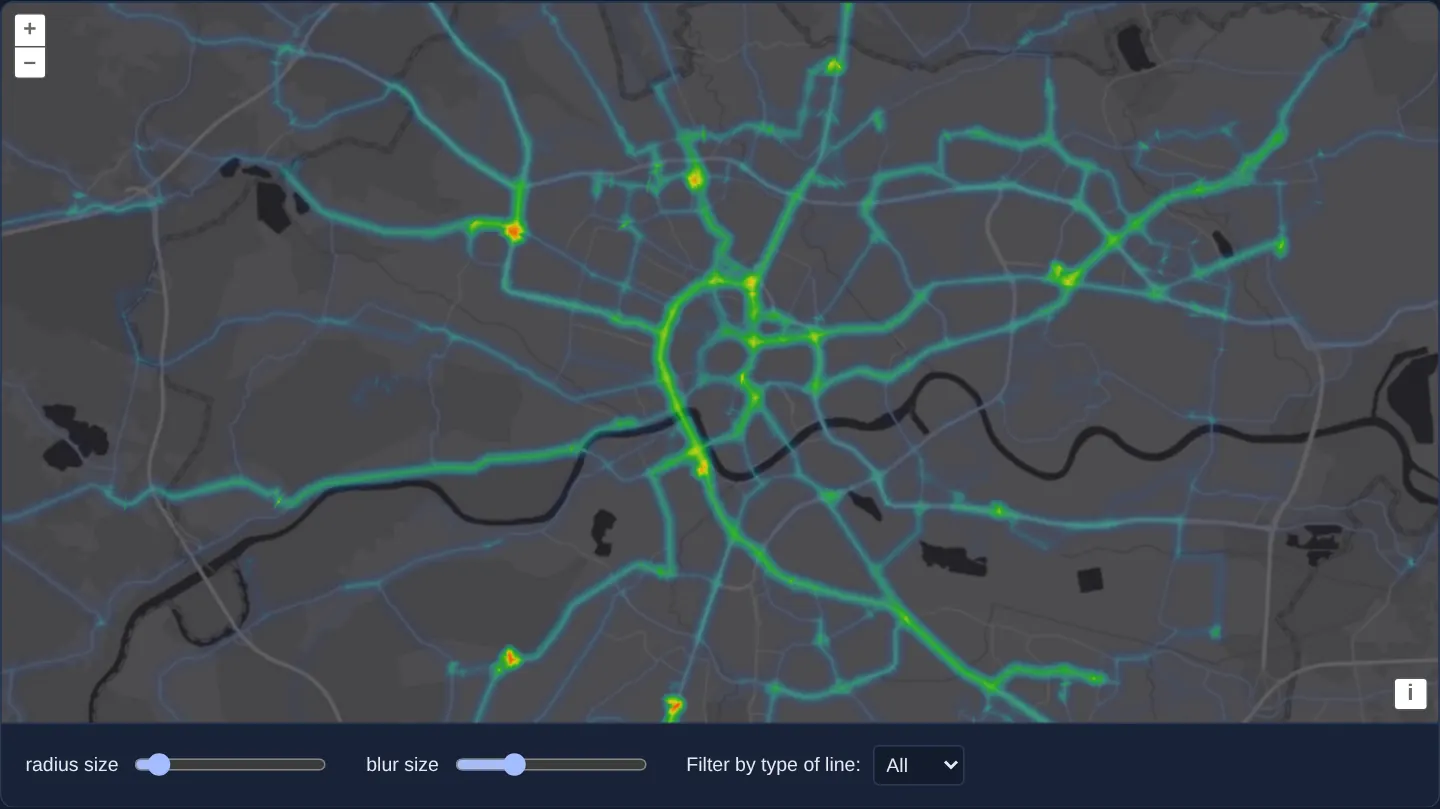
Over Esri’s World Dark Gray basemap of Kraków, 371 public-transit LineString routes from ZTP’s GTFS network (assets/krakow/transit-routes.geojson) render as glowing corridor ribbons—brightest around the First Ring Road and major radial avenues—with live Radius, Blur and Route type (All, Tram, Bus, and Night, which mixes night trams with night buses) controls.
When you need it
Public-transit planners, maritime AIS analysts, airline network strategists and Strava-style cycling maps aggregate hundreds of overlapping LineString trajectories to highlight shared trunk corridors.
OpenLayers’ Heatmap layer natively supports LineString geometries alongside points—and accepts WebGL style variables inside [radius], [blur] and [filter] for zero-recompilation filtering.
The code
The example uses cc-openlayers, my Angular component library for OpenLayers: each aol-… element creates the OpenLayers object it names, updates it from its inputs and disposes of it with the component.
heatmap-trajectories.shared.tsimport type { Options } from 'ol/layer/Heatmap.js';
/** The kinds of line in `transit-routes.geojson`; night trams and buses are their own kind. */
export const TYPES = ['All', 'Tram', 'Bus', 'Night'] as const;
/** One of the kinds of line. */
export type LineType = (typeof TYPES)[number];
/** Lets a line through when the style variable `type` is `All` or equals the line's own type. */
export const filter: Options['filter'] = [
'any',
['==', ['var', 'type'], 'All'],
['==', ['var', 'type'], ['get', 'type']],
];
/** The weight of every line: a faint heat that gathers where many lines overlap. */
export const weight = () => 0.1;heatmap-trajectories.tsimport { ChangeDetectionStrategy, Component, computed, signal } from '@angular/core';
import GeoJSON from 'ol/format/GeoJSON';
import {
CoordinateComponent,
DefaultControlComponent,
DefaultInteractionComponent,
LayerTileComponent,
MapComponent,
SourceImageTileComponent,
SourceVectorComponent,
ViewComponent,
} from 'cc-openlayers';
import { LayerHeatmapComponent } from 'cc-openlayers/webgl';
import { filter, TYPES, weight, type LineType } from './heatmap-trajectories.shared';
/**
* Lines drawn as a heatmap: the routes of Kraków's trams and buses, one line string per line and direction, made from
* the timetables of the city's Public Transport Authority, over Esri's dark grey canvas. The heat gathers where many
* lines share a street. The radius and the blur are expressions over style variables, which the sliders update in
* place, as is the type of line the filter lets through.
*/
@Component({
selector: 'app-heatmap-trajectories',
imports: [
CoordinateComponent,
DefaultControlComponent,
DefaultInteractionComponent,
LayerHeatmapComponent,
LayerTileComponent,
MapComponent,
SourceImageTileComponent,
SourceVectorComponent,
ViewComponent,
],
changeDetection: ChangeDetectionStrategy.OnPush,
template: `
<aol-map height="480px">
<aol-interaction-default />
<aol-control-defaults />
<aol-view [zoom]="12">
<aol-coordinate [x]="19.9373" [y]="50.0617" srid="EPSG:4326" />
</aol-view>
<aol-layer-tile>
<aol-source-imagetile
url="https://server.arcgisonline.com/ArcGIS/rest/services/Canvas/World_Dark_Gray_Base/MapServer/tile/{z}/{y}/{x}"
[maxZoom]="16"
attributions="Tiles © Esri — Esri, HERE, Garmin, © OpenStreetMap contributors, and the GIS user community"
/>
</aol-layer-tile>
<aol-layer-heatmap
[blur]="['/', ['var', 'blur'], 2]"
[radius]="['/', ['var', 'radius'], 2]"
[variables]="variables()"
[filter]="filter"
[weight]="weight"
>
<aol-source-vector
url="assets/krakow/transit-routes.geojson"
[format]="format"
attributions="Routes: ZTP Kraków"
/>
</aol-layer-heatmap>
</aol-map>
<div class="example-controls">
<label>
radius size
<input
name="radius"
type="range"
min="1"
max="50"
step="1"
[value]="radius()"
(input)="radius.set(read($event))"
/>
</label>
<label>
blur size
<input name="blur" type="range" min="1" max="50" step="1" [value]="blur()" (input)="blur.set(read($event))" />
</label>
<label>
Filter by type of line:
<select name="type" (change)="type.set(choice($event))">
@for (option of types; track option) {
<option [selected]="option === type()">{{ option }}</option>
}
</select>
</label>
</div>
`,
})
export class HeatmapTrajectories {
protected readonly format = new GeoJSON();
protected readonly types = TYPES;
protected readonly radius = signal(5);
protected readonly blur = signal(15);
protected readonly type = signal<LineType>('All');
protected readonly variables = computed(() => ({ blur: this.blur(), radius: this.radius(), type: this.type() }));
protected readonly filter = filter;
protected readonly weight = weight;
protected read(event: Event): number {
return parseInt((event.target as HTMLInputElement).value, 10);
}
protected choice(event: Event): LineType {
return (event.target as HTMLSelectElement).value as LineType;
}
} The React version uses the library's React adapter, cc-openlayers/react: each component creates the OpenLayers object it names when it mounts, updates it from its props and disposes of it when it unmounts.
heatmap-trajectories.react.tsximport { useMemo, useState, type ChangeEvent } from 'react';
import GeoJSON from 'ol/format/GeoJSON.js';
import {
Coordinate,
DefaultControls,
DefaultInteractions,
ImageTileSource,
Map,
TileLayer,
VectorSource,
View,
} from 'cc-openlayers/react';
import { HeatmapLayer } from 'cc-openlayers/react/webgl';
import { filter, TYPES, weight, type LineType } from './heatmap-trajectories.shared';
const format = new GeoJSON();
const blurExpression = ['/', ['var', 'blur'], 2];
const radiusExpression = ['/', ['var', 'radius'], 2];
const read = (event: ChangeEvent<HTMLInputElement>): number => parseInt(event.target.value, 10);
/**
* Lines drawn as a heatmap: the routes of Kraków's trams and buses, one line string per line and direction, made from
* the timetables of the city's Public Transport Authority, over Esri's dark grey canvas. The heat gathers where many
* lines share a street. The radius and the blur are expressions over style variables, which the sliders update in
* place, as is the type of line the filter lets through.
*/
export function HeatmapTrajectories() {
const [radius, setRadius] = useState(5);
const [blur, setBlur] = useState(15);
const [type, setType] = useState<LineType>('All');
const variables = useMemo(() => ({ blur, radius, type }), [blur, radius, type]);
return (
<>
<Map height="480px">
<DefaultInteractions />
<DefaultControls />
<View zoom={12}>
<Coordinate x={19.9373} y={50.0617} srid="EPSG:4326" />
</View>
<TileLayer>
<ImageTileSource
url="https://server.arcgisonline.com/ArcGIS/rest/services/Canvas/World_Dark_Gray_Base/MapServer/tile/{z}/{y}/{x}"
maxZoom={16}
attributions="Tiles © Esri — Esri, HERE, Garmin, © OpenStreetMap contributors, and the GIS user community"
/>
</TileLayer>
<HeatmapLayer
blur={blurExpression}
radius={radiusExpression}
variables={variables}
filter={filter}
weight={weight}
>
<VectorSource url="assets/krakow/transit-routes.geojson" format={format} attributions="Routes: ZTP Kraków" />
</HeatmapLayer>
</Map>
<div className="example-controls">
<label>
radius size
<input
name="radius"
type="range"
min="1"
max="50"
step="1"
value={radius}
onChange={(event) => setRadius(read(event))}
/>
</label>
<label>
blur size
<input
name="blur"
type="range"
min="1"
max="50"
step="1"
value={blur}
onChange={(event) => setBlur(read(event))}
/>
</label>
<label>
Filter by type of line:
<select name="type" value={type} onChange={(event) => setType(event.target.value as LineType)}>
{TYPES.map((option) => (
<option key={option}>{option}</option>
))}
</select>
</label>
</div>
</>
);
}heatmap-trajectories.shared.tsimport type { Options } from 'ol/layer/Heatmap.js';
/** The kinds of line in `transit-routes.geojson`; night trams and buses are their own kind. */
export const TYPES = ['All', 'Tram', 'Bus', 'Night'] as const;
/** One of the kinds of line. */
export type LineType = (typeof TYPES)[number];
/** Lets a line through when the style variable `type` is `All` or equals the line's own type. */
export const filter: Options['filter'] = [
'any',
['==', ['var', 'type'], 'All'],
['==', ['var', 'type'], ['get', 'type']],
];
/** The weight of every line: a faint heat that gathers where many lines overlap. */
export const weight = () => 0.1;How the React version works
The routes of Kraków's trams and buses drawn as a heatmap of lines, so the heat counts the lines sharing a street; sliders set the radius and blur, a list chooses day or night lines.
What both versions share
OpenLayers renders the map and handles the interactions; the cc-openlayers/core layer gives both adapters the same view binding (MapViewBinding) and the same conversion of coordinates from EPSG:4326 to the map's projection. OpenLayers draws the tiles with WebGL; the style expressions run on the GPU in both versions. Both versions import the line types, the filter and the weight from the example's .shared.ts file, so the logic exists once.
From Angular to React
| Angular | React |
|---|---|
<aol-layer-heatmap [variables]> | <HeatmapLayer variables>, the variables made in useMemo |
the sliders and list in signals | useState |
Who creates, updates and disposes
Map creates the ol/Map in useLayoutEffect and disposes of it on unmount; each layer, source and interaction component adds its object to the parent it gets from context and removes it in its effect's cleanup, as ngOnDestroy does in Angular.
Architecture and OpenLayers mechanics
Line strings load from assets/krakow/transit-routes.geojson with uniform weight () => 0.1 so overlapping routes accumulate intensity linearly. On the Heatmap layer, [blur]="['/', ['var', 'blur'], 2]" and [radius]="['/', ['var', 'radius'], 2]" scale slider inputs dynamically, while the GPU filter passes all routes when ['==', ['var', 'type'], 'All'] or matches a specific transit type via computed [variables]="variables()".
How it works
- 371 transit line strings load from
assets/krakow/transit-routes.geojsonwith per-routeweight() => 0.1. - Expressions
[blur]="['/', ['var', 'blur'], 2]"and[radius]="['/', ['var', 'radius'], 2]"read live uniform values. - A variable-driven filter switches cleanly between
['==', ['var', 'type'], 'All']and specific transit categories. [variables]="variables()"updatesblur,radiusandtypevia updateStyleVariables without rebuilding shaders.
Pitfalls
- Passing a static filter expression that reads
['var', 'type']switches vehicle categories instantaneously in GPU uniforms, whereas calling setFilter with a brand-new filter array on each dropdown change triggers full WebGL shader recompilation.
Related examples
The same feature in the OpenLayers examples .
Background: state and lifecycle of maps in Angular with OpenLayers, which the components of cc-openlayers take care of.