Raster, GeoTIFF and WebGL · Angular, React and OpenLayers
A heatmap of tremors from KML
Render 1,130 KML seismic events across Upper Silesia and Kraków as a magnitude-weighted OpenLayers Heatmap layer with radius and blur sliders.
What this example shows
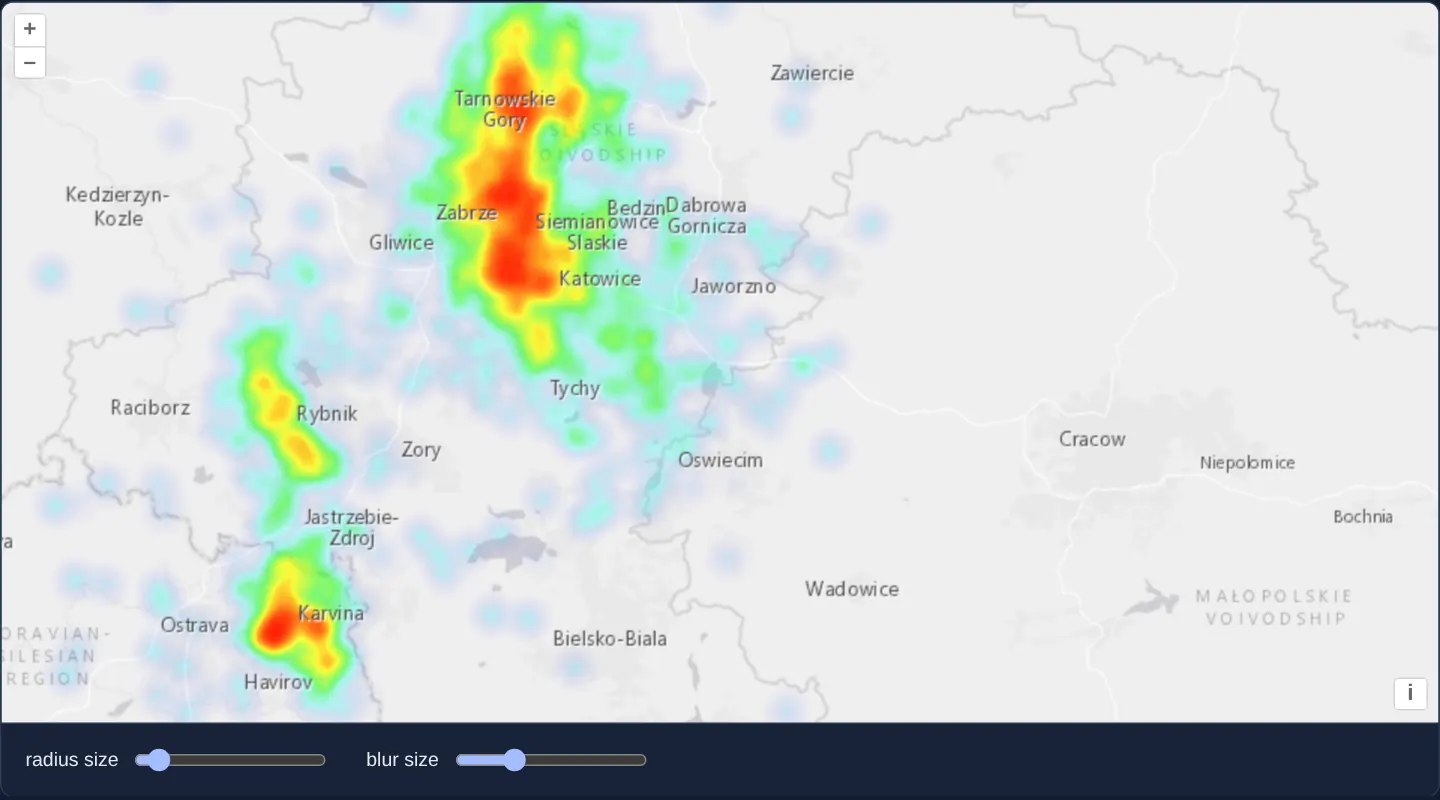
Sandwiched cleanly between Esri’s World Light Gray base map and an upper reference layer of town labels, 1,130 seismic tremors from assets/krakow/tremors.kml glow as a continuous density heatmap peaking over Upper Silesia and Karviná, with live range sliders adjusting kernel radius (starting at 5) and blur (starting at 15).
When you need it
When hundreds of tremors, emergency calls, wildlife sightings or retail deliveries stack directly on top of the same coordinates, discrete circle markers saturate into opaque blobs whereas a weighted kernel-density heatmap reveals true hotspots.
Sandwiching the WebGL heatmap below a transparent reference label layer keeps city names crisp and readable right over intense red hotspots.
The code
The example uses cc-openlayers, my Angular component library for OpenLayers: each aol-… element creates the OpenLayers object it names, updates it from its inputs and disposes of it with the component.
heatmap-earthquakes.shared.tsimport type { FeatureLike } from 'ol/Feature.js';
/** The heat weight of a tremor: its magnitude above 2, read from the name ("M 3.4 - 1995 Mar 7") in tremors.kml. */
export const weight = (feature: FeatureLike): number => {
// every event has a magnitude of 2 or more.
const name: string = feature.get('name');
const magnitude = parseFloat(name.slice(2));
return magnitude - 2;
};heatmap-earthquakes.tsimport { ChangeDetectionStrategy, Component, signal } from '@angular/core';
import KML from 'ol/format/KML';
import {
CoordinateComponent,
DefaultControlComponent,
DefaultInteractionComponent,
LayerTileComponent,
MapComponent,
SourceImageTileComponent,
SourceVectorComponent,
ViewComponent,
} from 'cc-openlayers';
import { LayerHeatmapComponent } from 'cc-openlayers/webgl';
import { weight } from './heatmap-earthquakes.shared';
/**
* The seismic events around Kraków since 1978, most of them mining tremors of the Upper Silesian coal basin west of
* the city, read from a KML file and drawn as a heatmap weighted by magnitude; the sliders set its radius and blur.
*/
@Component({
selector: 'app-heatmap-earthquakes',
imports: [
CoordinateComponent,
DefaultControlComponent,
DefaultInteractionComponent,
LayerHeatmapComponent,
LayerTileComponent,
MapComponent,
SourceImageTileComponent,
SourceVectorComponent,
ViewComponent,
],
changeDetection: ChangeDetectionStrategy.OnPush,
template: `
<aol-map height="480px">
<aol-interaction-default />
<aol-control-defaults />
<aol-view [zoom]="9">
<aol-coordinate [x]="19.25" [y]="50.15" srid="EPSG:4326" />
</aol-view>
<aol-layer-tile>
<aol-source-imagetile
url="https://server.arcgisonline.com/ArcGIS/rest/services/Canvas/World_Light_Gray_Base/MapServer/tile/{z}/{y}/{x}"
[maxZoom]="16"
attributions="Tiles © Esri — Esri, HERE, Garmin, © OpenStreetMap contributors, and the GIS user community"
/>
</aol-layer-tile>
<aol-layer-heatmap [blur]="blur()" [radius]="radius()" [weight]="weight">
<aol-source-vector
url="assets/krakow/tremors.kml"
[format]="format"
attributions="Seismic events: U.S. Geological Survey"
/>
</aol-layer-heatmap>
<aol-layer-tile>
<aol-source-imagetile
url="https://server.arcgisonline.com/ArcGIS/rest/services/Canvas/World_Light_Gray_Reference/MapServer/tile/{z}/{y}/{x}"
[maxZoom]="16"
/>
</aol-layer-tile>
</aol-map>
<div class="example-controls">
<label>
radius size
<input
name="radius"
type="range"
min="1"
max="50"
step="1"
[value]="radius()"
(input)="radius.set(read($event))"
/>
</label>
<label>
blur size
<input name="blur" type="range" min="1" max="50" step="1" [value]="blur()" (input)="blur.set(read($event))" />
</label>
</div>
`,
})
export class HeatmapEarthquakes {
protected readonly radius = signal(5);
protected readonly blur = signal(15);
protected readonly format = new KML({
extractStyles: false,
});
protected readonly weight = weight;
protected read(event: Event): number {
return parseInt((event.target as HTMLInputElement).value, 10);
}
} The React version uses the library's React adapter, cc-openlayers/react: each component creates the OpenLayers object it names when it mounts, updates it from its props and disposes of it when it unmounts.
heatmap-earthquakes.react.tsximport { useState, type ChangeEvent } from 'react';
import KML from 'ol/format/KML.js';
import {
Coordinate,
DefaultControls,
DefaultInteractions,
ImageTileSource,
Map,
TileLayer,
VectorSource,
View,
} from 'cc-openlayers/react';
import { HeatmapLayer } from 'cc-openlayers/react/webgl';
import { weight } from './heatmap-earthquakes.shared';
const format = new KML({
extractStyles: false,
});
const read = (event: ChangeEvent<HTMLInputElement>): number => parseInt(event.target.value, 10);
/**
* The seismic events around Kraków since 1978, most of them mining tremors of the Upper Silesian coal basin west of
* the city, read from a KML file and drawn as a heatmap weighted by magnitude; the sliders set its radius and blur.
*/
export function HeatmapEarthquakes() {
const [radius, setRadius] = useState(5);
const [blur, setBlur] = useState(15);
return (
<>
<Map height="480px">
<DefaultInteractions />
<DefaultControls />
<View zoom={9}>
<Coordinate x={19.25} y={50.15} srid="EPSG:4326" />
</View>
<TileLayer>
<ImageTileSource
url="https://server.arcgisonline.com/ArcGIS/rest/services/Canvas/World_Light_Gray_Base/MapServer/tile/{z}/{y}/{x}"
maxZoom={16}
attributions="Tiles © Esri — Esri, HERE, Garmin, © OpenStreetMap contributors, and the GIS user community"
/>
</TileLayer>
<HeatmapLayer blur={blur} radius={radius} weight={weight}>
<VectorSource
url="assets/krakow/tremors.kml"
format={format}
attributions="Seismic events: U.S. Geological Survey"
/>
</HeatmapLayer>
<TileLayer>
<ImageTileSource
url="https://server.arcgisonline.com/ArcGIS/rest/services/Canvas/World_Light_Gray_Reference/MapServer/tile/{z}/{y}/{x}"
maxZoom={16}
/>
</TileLayer>
</Map>
<div className="example-controls">
<label>
radius size
<input
name="radius"
type="range"
min="1"
max="50"
step="1"
value={radius}
onChange={(event) => setRadius(read(event))}
/>
</label>
<label>
blur size
<input
name="blur"
type="range"
min="1"
max="50"
step="1"
value={blur}
onChange={(event) => setBlur(read(event))}
/>
</label>
</div>
</>
);
}heatmap-earthquakes.shared.tsimport type { FeatureLike } from 'ol/Feature.js';
/** The heat weight of a tremor: its magnitude above 2, read from the name ("M 3.4 - 1995 Mar 7") in tremors.kml. */
export const weight = (feature: FeatureLike): number => {
// every event has a magnitude of 2 or more.
const name: string = feature.get('name');
const magnitude = parseFloat(name.slice(2));
return magnitude - 2;
};How the React version works
Seismic events around Kraków since 1978 drawn as a heatmap weighted by magnitude between a light grey base map and its labels; sliders set the radius and the blur.
What both versions share
OpenLayers renders the map and handles the interactions; the cc-openlayers/core layer gives both adapters the same view binding (MapViewBinding) and the same conversion of coordinates from EPSG:4326 to the map's projection. OpenLayers draws the tiles with WebGL; the style expressions run on the GPU in both versions. Both versions import the weight function from the example's .shared.ts file, so the logic exists once.
From Angular to React
| Angular | React |
|---|---|
<aol-layer-heatmap [radius] [blur] [weight]> | <HeatmapLayer radius blur weight> from cc-openlayers/react/webgl |
the sliders and signals | useState |
Who creates, updates and disposes
Map creates the ol/Map in useLayoutEffect and disposes of it on unmount; each layer, source and interaction component adds its object to the parent it gets from context and removes it in its effect's cleanup, as ngOnDestroy does in Angular.
Architecture and OpenLayers mechanics
The vector source loads assets/krakow/tremors.kml via new KML({ with extractStyles: false. On the Heatmap layer, weight parses magnitude from each placemark’s name (parseFloat(name.slice(2))) and subtracts 2, while [radius]="radius()" and [blur]="blur()" invoke setRadius and setBlur directly for instant GPU re-rendering.
How it works
assets/krakow/tremors.kmlloads withnew KML({andextractStyles: falseso KML pushpins are ignored.weightextracts event magnitude viaparseFloat(name.slice(2))and returnsmagnitude - 2.[radius]="radius()"and[blur]="blur()"start at5and15, updating the WebGL heatmap without shader recompilation.- Placing Esri’s reference label tiles above the heatmap keeps town names legible over dense clusters.
Pitfalls
- OpenLayers clamps Heatmap
weightreturn values strictly to [0, 1]: returningmagnitude - 2unscaled means every tremor of M 3.0 or stronger clamps to 1.0—divide by (maxMagnitude - 2) when you want M 5.0 events weighted more heavily than M 3.0. - Plain numeric
[radius]and[blur]inputs update uniforms cheaply viasetRadius/setBlur; if you pass WebGL expressions instead, reference a style variable inside them to avoid recompiling shaders.
Related examples
The same feature in the OpenLayers examples .
Background: state and lifecycle of maps in Angular with OpenLayers, which the components of cc-openlayers take care of.