Raster, GeoTIFF and WebGL · Angular, React and OpenLayers
Tremors filtered by year on the GPU
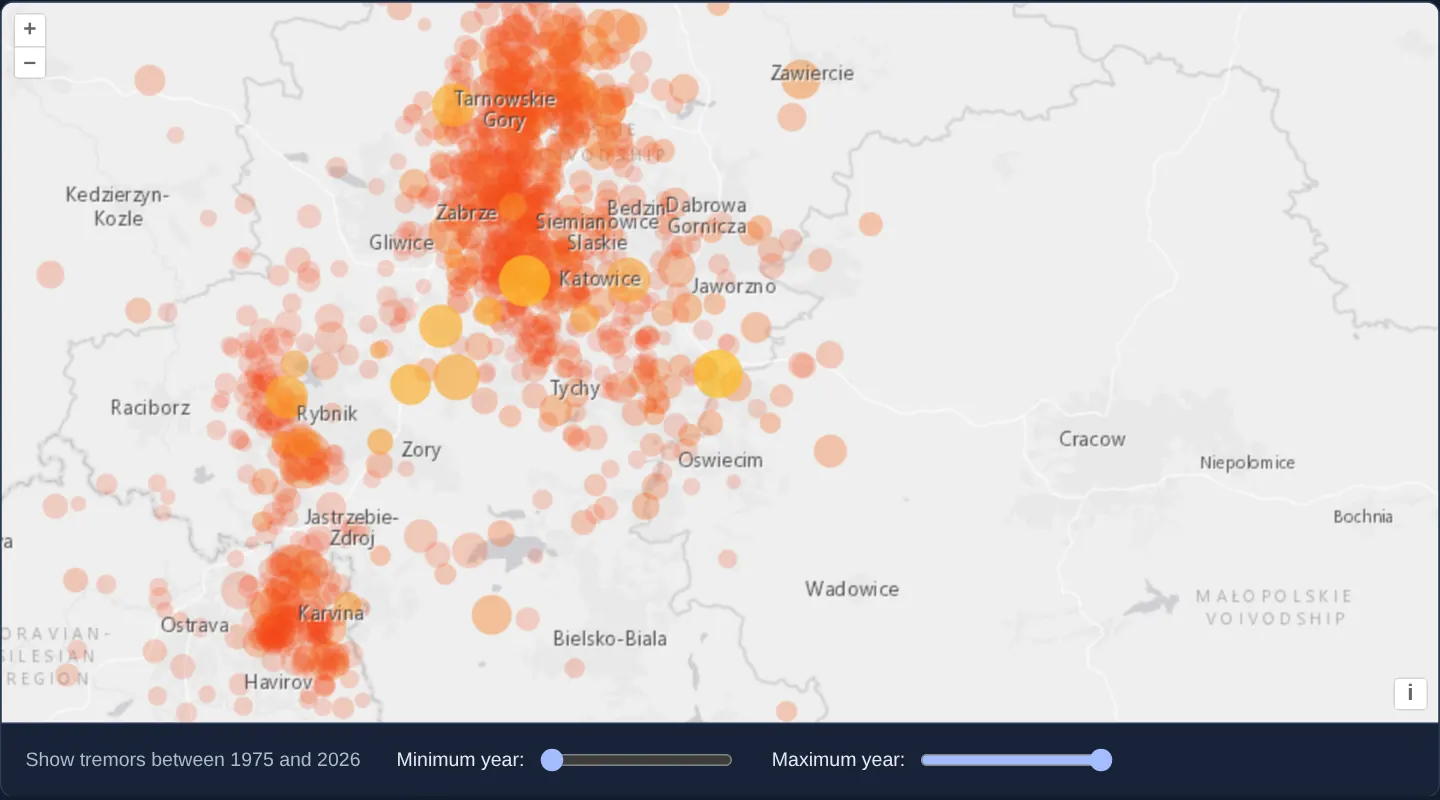
Filter 1,130 pulsing seismic points by year range live on the GPU in OpenLayers using WebGL style variables and between filter expressions.
What this example shows
Over Esri’s World Light Gray basemap across Upper Silesia, Kraków and Karviná, 1,130 seismic events loaded from assets/krakow/tremors.csv pulse out of phase as magnitude-sized yellow-to-red circles while two range sliders (minYear and maxYear) filter visible decades instantaneously at 60 fps.
When you need it
Historical incident explorers, real-estate transaction maps, epidemiological timelines and crime atlases let analysts scrub start-and-end date sliders across tens of thousands of points.
Evaluating between filters in the WebGL vertex shader via uniform variables hides and reveals thousands of points per millisecond without touching the JavaScript feature array.
The code
The example uses cc-openlayers, my Angular component library for OpenLayers: each aol-… element creates the OpenLayers object it names, updates it from its inputs and disposes of it with the component.
filter-points-webgl.shared.tsimport Feature from 'ol/Feature.js';
import Point from 'ol/geom/Point.js';
import { fromLonLat } from 'ol/proj.js';
import type { ExpressionValue } from 'ol/expr/expression.js';
import type { FlatStyle, Rule } from 'ol/style/flat.js';
const oldColor = 'rgba(242,56,22,0.61)';
const newColor = '#ffe52c';
const period = 12; // animation period in seconds
const animRatio: ExpressionValue = [
'^',
['/', ['%', ['+', ['time'], ['interpolate', ['linear'], ['get', 'year'], 1975, 0, 2026, period]], period], period],
0.5,
];
const style: FlatStyle = {
'circle-radius': [
'*',
['interpolate', ['linear'], ['get', 'magnitude'], 2, 4, 5, 13],
['-', 1.75, ['*', animRatio, 0.75]],
],
'circle-fill-color': ['interpolate', ['linear'], animRatio, 0, newColor, 1, oldColor],
'circle-opacity': ['-', 1.0, ['*', animRatio, 0.75]],
};
/** The tremors of a CSV file of id, magnitude, year, latitude and longitude, one per line after the header. */
export function readTremors(csv: string): Feature[] {
const features: Feature[] = [];
for (const row of csv.split('\n').slice(1)) {
const line = row.split(',');
const coords = fromLonLat([parseFloat(line[4]), parseFloat(line[3])]);
if (isNaN(coords[0]) || isNaN(coords[1])) {
// guard against bad data
continue;
}
features.push(
new Feature({
magnitude: parseFloat(line[1]) || 0,
year: parseInt(line[2]) || 0,
geometry: new Point(coords),
})
);
}
return features;
}
/** The rule that draws the tremors whose year lies between the style variables `minYear` and `maxYear`. */
export const pointsStyle: Rule[] = [
{
style,
filter: ['between', ['get', 'year'], ['var', 'minYear'], ['var', 'maxYear']],
},
];filter-points-webgl.tsimport {
afterNextRender,
ChangeDetectionStrategy,
Component,
DestroyRef,
inject,
signal,
viewChild,
} from '@angular/core';
import {
CoordinateComponent,
DefaultControlComponent,
DefaultInteractionComponent,
LayerTileComponent,
MapComponent,
SourceImageTileComponent,
SourceVectorComponent,
ViewComponent,
} from 'cc-openlayers';
import { LayerWebGLVectorComponent } from 'cc-openlayers/webgl';
import { pointsStyle, readTremors } from './filter-points-webgl.shared';
/**
* The seismic events around Kraków since 1978 drawn by a WebGL vector layer that filters them by year: the sliders
* change the style variables of the filter, a circle's size follows the magnitude, and a pulse offset by the year
* animates the points, the map rendering on every animation frame.
*/
@Component({
selector: 'app-filter-points-webgl',
imports: [
CoordinateComponent,
DefaultControlComponent,
DefaultInteractionComponent,
LayerTileComponent,
LayerWebGLVectorComponent,
MapComponent,
SourceImageTileComponent,
SourceVectorComponent,
ViewComponent,
],
changeDetection: ChangeDetectionStrategy.OnPush,
template: `
<aol-map height="480px">
<aol-interaction-default />
<aol-control-defaults />
<aol-view [zoom]="9">
<aol-coordinate [x]="19.25" [y]="50.15" srid="EPSG:4326" />
</aol-view>
<aol-layer-tile>
<aol-source-imagetile
url="https://server.arcgisonline.com/ArcGIS/rest/services/Canvas/World_Light_Gray_Base/MapServer/tile/{z}/{y}/{x}"
[maxZoom]="16"
attributions="Tiles © Esri — Esri, HERE, Garmin, © OpenStreetMap contributors, and the GIS user community"
/>
</aol-layer-tile>
<aol-layer-webglvector [style]="pointsStyle" [variables]="years()" [disableHitDetection]="true">
<aol-source-vector attributions="Seismic events: U.S. Geological Survey" />
</aol-layer-webglvector>
<aol-layer-tile>
<aol-source-imagetile
url="https://server.arcgisonline.com/ArcGIS/rest/services/Canvas/World_Light_Gray_Reference/MapServer/tile/{z}/{y}/{x}"
[maxZoom]="16"
/>
</aol-layer-tile>
</aol-map>
<div class="example-controls">
<p>Show tremors between {{ years().minYear }} and {{ years().maxYear }}</p>
<label>
Minimum year:
<input
name="min-year"
type="range"
min="1975"
max="2026"
step="1"
[value]="years().minYear"
(input)="set('minYear', $event)"
/>
</label>
<label>
Maximum year:
<input
name="max-year"
type="range"
min="1975"
max="2026"
step="1"
[value]="years().maxYear"
(input)="set('maxYear', $event)"
/>
</label>
</div>
`,
})
export class FilterPointsWebgl {
readonly years = signal({ minYear: 1975, maxYear: 2026 });
protected readonly pointsStyle = pointsStyle;
private readonly map = viewChild.required(MapComponent);
private readonly source = viewChild.required(SourceVectorComponent);
constructor() {
// load data
let destroyed = false;
inject(DestroyRef).onDestroy(() => (destroyed = true));
afterNextRender(async () => {
try {
const csv = await (await fetch('assets/krakow/tremors.csv')).text();
if (!destroyed) this.source().instance.addFeatures(readTremors(csv));
} catch (error) {
console.error('The tremors could not be loaded', error);
}
});
// animate the map
let frame = 0;
const animate = () => {
this.map().instance.render();
frame = window.requestAnimationFrame(animate);
};
afterNextRender(animate);
inject(DestroyRef).onDestroy(() => window.cancelAnimationFrame(frame));
}
protected set(bound: 'minYear' | 'maxYear', event: Event): void {
const year = parseInt((event.target as HTMLInputElement).value);
this.years.update((years) => ({ ...years, [bound]: year }));
}
} The React version uses the library's React adapter, cc-openlayers/react: each component creates the OpenLayers object it names when it mounts, updates it from its props and disposes of it when it unmounts.
filter-points-webgl.react.tsximport { useEffect, useRef, useState, type ChangeEvent } from 'react';
import type OLMap from 'ol/Map.js';
import type OLVectorSource from 'ol/source/Vector.js';
import {
Coordinate,
DefaultControls,
DefaultInteractions,
ImageTileSource,
Map,
TileLayer,
View,
VectorSource,
} from 'cc-openlayers/react';
import { WebGLVectorLayer } from 'cc-openlayers/react/webgl';
import { pointsStyle, readTremors } from './filter-points-webgl.shared';
/**
* The seismic events around Kraków since 1978 drawn by a WebGL vector layer that filters them by year: the sliders
* change the style variables of the filter, a circle's size follows the magnitude, and a pulse offset by the year
* animates the points, the map rendering on every animation frame.
*/
export function FilterPointsWebgl() {
const [years, setYears] = useState({ minYear: 1975, maxYear: 2026 });
const map = useRef<OLMap>(null);
// The source is made after the first commit, so the state carries it to the effect that loads the data.
const [source, setSource] = useState<OLVectorSource | null>(null);
// load data
useEffect(() => {
if (!source) return;
let current = true;
void (async () => {
const csv = await (await fetch('assets/krakow/tremors.csv')).text();
if (current) source.addFeatures(readTremors(csv));
})();
return () => {
current = false;
};
}, [source]);
// animate the map
useEffect(() => {
let frame = 0;
const animate = () => {
map.current?.render();
frame = window.requestAnimationFrame(animate);
};
frame = window.requestAnimationFrame(animate);
return () => window.cancelAnimationFrame(frame);
}, []);
const set = (bound: 'minYear' | 'maxYear', event: ChangeEvent<HTMLInputElement>) => {
const year = parseInt(event.target.value);
setYears((current) => ({ ...current, [bound]: year }));
};
return (
<>
<Map ref={map} height="480px">
<DefaultInteractions />
<DefaultControls />
<View zoom={9}>
<Coordinate x={19.25} y={50.15} srid="EPSG:4326" />
</View>
<TileLayer>
<ImageTileSource
url="https://server.arcgisonline.com/ArcGIS/rest/services/Canvas/World_Light_Gray_Base/MapServer/tile/{z}/{y}/{x}"
maxZoom={16}
attributions="Tiles © Esri — Esri, HERE, Garmin, © OpenStreetMap contributors, and the GIS user community"
/>
</TileLayer>
<WebGLVectorLayer style={pointsStyle} variables={years} disableHitDetection>
<VectorSource ref={setSource} attributions="Seismic events: U.S. Geological Survey" />
</WebGLVectorLayer>
<TileLayer>
<ImageTileSource
url="https://server.arcgisonline.com/ArcGIS/rest/services/Canvas/World_Light_Gray_Reference/MapServer/tile/{z}/{y}/{x}"
maxZoom={16}
/>
</TileLayer>
</Map>
<div className="example-controls">
<p>
Show tremors between {years.minYear} and {years.maxYear}
</p>
<label>
Minimum year:
<input
name="min-year"
type="range"
min="1975"
max="2026"
step="1"
value={years.minYear}
onChange={(event) => set('minYear', event)}
/>
</label>
<label>
Maximum year:
<input
name="max-year"
type="range"
min="1975"
max="2026"
step="1"
value={years.maxYear}
onChange={(event) => set('maxYear', event)}
/>
</label>
</div>
</>
);
}filter-points-webgl.shared.tsimport Feature from 'ol/Feature.js';
import Point from 'ol/geom/Point.js';
import { fromLonLat } from 'ol/proj.js';
import type { ExpressionValue } from 'ol/expr/expression.js';
import type { FlatStyle, Rule } from 'ol/style/flat.js';
const oldColor = 'rgba(242,56,22,0.61)';
const newColor = '#ffe52c';
const period = 12; // animation period in seconds
const animRatio: ExpressionValue = [
'^',
['/', ['%', ['+', ['time'], ['interpolate', ['linear'], ['get', 'year'], 1975, 0, 2026, period]], period], period],
0.5,
];
const style: FlatStyle = {
'circle-radius': [
'*',
['interpolate', ['linear'], ['get', 'magnitude'], 2, 4, 5, 13],
['-', 1.75, ['*', animRatio, 0.75]],
],
'circle-fill-color': ['interpolate', ['linear'], animRatio, 0, newColor, 1, oldColor],
'circle-opacity': ['-', 1.0, ['*', animRatio, 0.75]],
};
/** The tremors of a CSV file of id, magnitude, year, latitude and longitude, one per line after the header. */
export function readTremors(csv: string): Feature[] {
const features: Feature[] = [];
for (const row of csv.split('\n').slice(1)) {
const line = row.split(',');
const coords = fromLonLat([parseFloat(line[4]), parseFloat(line[3])]);
if (isNaN(coords[0]) || isNaN(coords[1])) {
// guard against bad data
continue;
}
features.push(
new Feature({
magnitude: parseFloat(line[1]) || 0,
year: parseInt(line[2]) || 0,
geometry: new Point(coords),
})
);
}
return features;
}
/** The rule that draws the tremors whose year lies between the style variables `minYear` and `maxYear`. */
export const pointsStyle: Rule[] = [
{
style,
filter: ['between', ['get', 'year'], ['var', 'minYear'], ['var', 'maxYear']],
},
];How the React version works
Seismic events around Kraków since 1978 drawn by a WebGL vector layer that filters them by year with two sliders, sized by magnitude and pulsing.
What both versions share
OpenLayers renders the map and handles the interactions; the cc-openlayers/core layer gives both adapters the same view binding (MapViewBinding) and the same conversion of coordinates from EPSG:4326 to the map's projection. OpenLayers draws the tiles with WebGL; the style expressions run on the GPU in both versions. Both versions import reading the CSV and the point style from the example's .shared.ts file, so the logic exists once.
From Angular to React
| Angular | React |
|---|---|
loading the CSV into viewChild of the source | ref={setSource} into useState and a useEffect that fetches the file with a flag that drops the answer after unmount |
the sliders and style variables | useState of the years and variables on the layer |
requestAnimationFrame started in afterNextRender and cancelled through DestroyRef | a useEffect that requests frames and cancels the last one in its cleanup |
Who creates, updates and disposes
Map creates the ol/Map in useLayoutEffect and disposes of it on unmount; each layer, source and interaction component adds its object to the parent it gets from context and removes it in its effect's cleanup, as ngOnDestroy does in Angular.
Architecture and OpenLayers mechanics
readTremors parses assets/krakow/tremors.csv into Point features carrying numeric magnitude and year attributes. On the WebGL layer, the style rule’s filter checks year between ['var', 'minYear'] and ['var', 'maxYear'], updated without shader recompilation through [variables]="years()".
Circle radius (circle-radius) scales from 4 px (magnitude 2) to 13 px (magnitude 5) modulated by animRatio—a ['time'] wave offset per event’s year driven by animate—with [disableHitDetection]="true" skipping off-screen hit-buffer rendering.
How it works
- A GPU filter expression keeps points whose
yearliesbetween['var', 'minYear']and['var', 'maxYear'], fed by[variables]="years()". circle-radiusscales withmagnitude(4 px at M2 to 13 px at M5) and pulses viaanimRatio.animRatiocombines['time']with each event’syearso circles pulse out of sync across animation frames driven byanimate.readTremorsparsesassets/krakow/tremors.csvintoPointfeatures with numericmagnitudeandyearfields.
Pitfalls
- Setting
[disableHitDetection]="true"saves GPU memory and frame time on pure-visual layers, but calling forEachFeatureAtPixel against that layer will throw an error—leave hit detection enabled whenever click/hover inspection is needed. - Reference
['var', 'minYear']inside a static filter rather than rebuilding the filter array on slider input so shaders compile only once.
Related examples
The same feature in the OpenLayers examples .
Background: state and lifecycle of maps in Angular with OpenLayers, which the components of cc-openlayers take care of.