Raster, GeoTIFF and WebGL · Angular, React and OpenLayers
Filter a WebGL icon atlas
Render Kraków landmarks from a single SVG sprite atlas in OpenLayers WebGLVectorLayer with live category filtering and observation-year tinting.
What this example shows
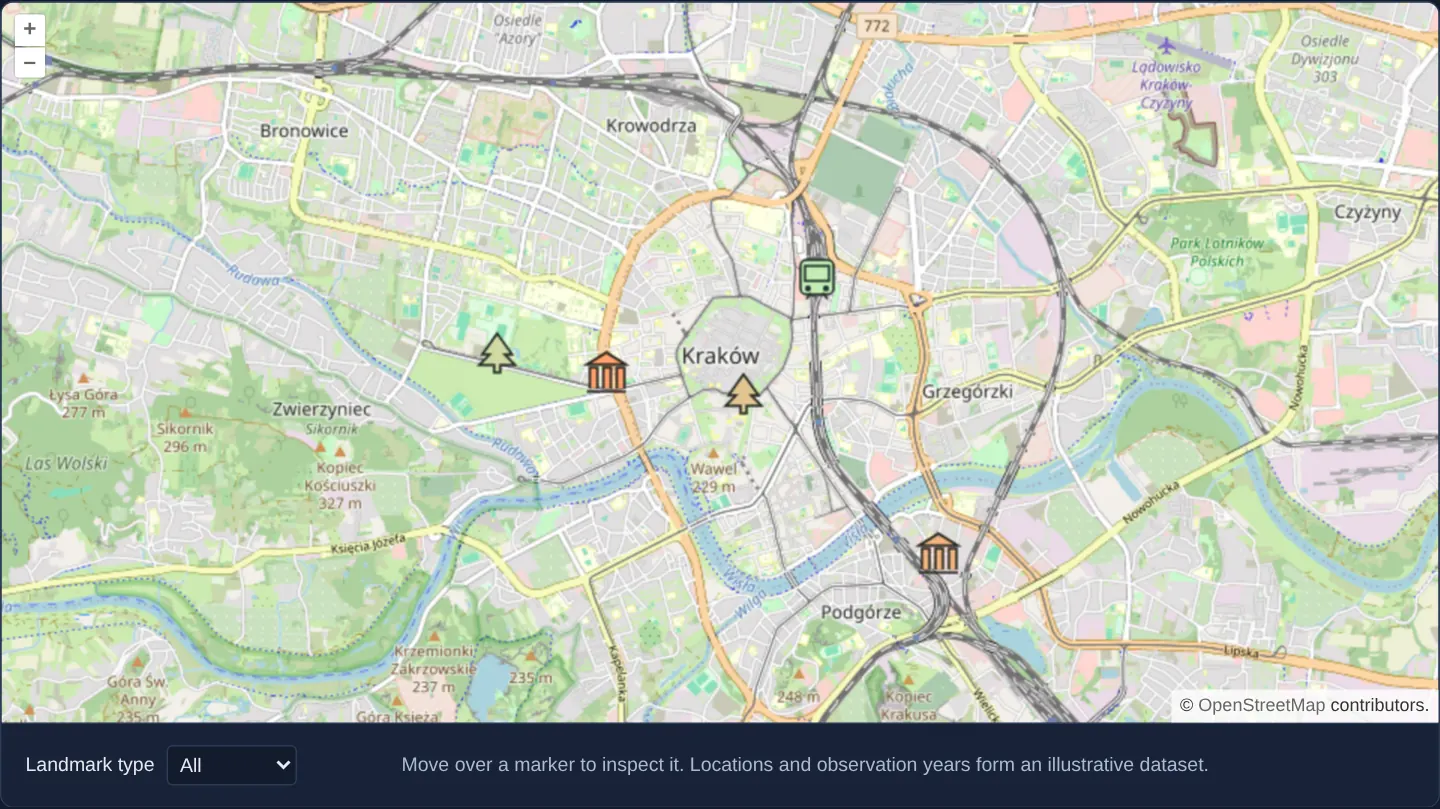
Over OpenStreetMap of Kraków, illustrative museum, park and transport landmarks render on the GPU from one shared SVG sprite sheet—each selecting its category glyph by pixel offset and blending a colour tint interpolated from its sample observation year.
Changing the category selector updates a WebGL style variable to filter visible symbols immediately, while hovering displays a plain-text label below the map.
When you need it
Point layers with thousands of multi-category assets perform best on the GPU when every symbol lives inside one packed sprite texture rather than dozens of separate icon requests.
Combining sprite-sheet sub-rectangles with dynamic RGBA tinting and uniform-variable category filters avoids rebuilding WebGL vertex buffers during UI filtering.
The code
The example uses cc-openlayers, my Angular component library for OpenLayers: each aol-… element creates the OpenLayers object it names, updates it from its inputs and disposes of it with the component.
icon-sprite-webgl.html<aol-map height="480px" (pointerMove)="hover($event)" (pointerleave)="hide()">
<aol-interaction-default />
<aol-control-defaults />
<aol-view [zoom]="13"><aol-coordinate [x]="19.9368" [y]="50.0614" srid="EPSG:4326" /></aol-view>
<aol-layer-tile><aol-source-osm /></aol-layer-tile>
<aol-layer-webglvector [style]="style" [variables]="{ filterType: filterType() }"
><aol-source-vector
/></aol-layer-webglvector>
</aol-map>
<div class="example-controls">
<label
>Landmark type
<select [value]="filterType()" (change)="filter($event)">
<option value="all">All</option>
<option value="museum">Museums</option>
<option value="park">Parks</option>
<option value="transport">Transport</option>
</select></label
><output aria-live="polite">{{ info() }}</output>
<p class="example-hint">
Move over a marker to inspect it. Locations and observation years form an illustrative dataset.
</p>
</div>icon-sprite-webgl.shared.tsimport Feature from 'ol/Feature.js';
import type { FeatureLike } from 'ol/Feature.js';
import Point from 'ol/geom/Point.js';
import { fromLonLat } from 'ol/proj.js';
import type { Rule } from 'ol/style/flat.js';
export const LANDMARKS = [
{ name: 'National Museum', type: 'museum', year: 2019, coordinate: [19.9238, 50.0607] },
{ name: 'MOCAK', type: 'museum', year: 2020, coordinate: [19.9618, 50.0474] },
{ name: 'Planty', type: 'park', year: 2021, coordinate: [19.9395, 50.0591] },
{ name: 'Park Jordana', type: 'park', year: 2022, coordinate: [19.9113, 50.0621] },
{ name: 'Kraków Główny', type: 'transport', year: 2023, coordinate: [19.9479, 50.0675] },
{ name: 'Kraków Airport station', type: 'transport', year: 2024, coordinate: [19.8029, 50.0706] },
];
const atlas = `<svg xmlns="http://www.w3.org/2000/svg" width="96" height="32" viewBox="0 0 96 32">
<g fill="white" stroke="#263238" stroke-width="1.5">
<path d="M3 11L16 3L29 11Z M5 27V13H10V27 M14 27V13H19V27 M23 27V13H28V27 M3 29H29"/>
<path d="M48 3L38 17H43L36 24H46V29H50V24H60L53 17H58Z"/>
<rect x="69" y="3" width="22" height="23" rx="4"/>
<path d="M72 7H88V17H72Z M73 29L76 25 M87 29L84 25"/>
</g><g fill="#263238"><circle cx="74" cy="22" r="2"/><circle cx="86" cy="22" r="2"/></g></svg>`;
export const SPRITE_STYLE: Rule[] = [
{
style: {
'icon-src': `data:image/svg+xml;charset=utf-8,${encodeURIComponent(atlas)}`,
'icon-width': 96,
'icon-height': 32,
'icon-size': [32, 32],
'icon-scale': 1,
'icon-offset': ['match', ['get', 'type'], 'museum', [0, 0], 'park', [32, 0], [64, 0]],
'icon-color': ['interpolate', ['linear'], ['get', 'year'], 2019, [255, 160, 110], 2024, [180, 255, 200]],
},
filter: ['any', ['==', ['var', 'filterType'], 'all'], ['==', ['var', 'filterType'], ['get', 'type']]],
},
];
export function landmarkFeatures(): Feature<Point>[] {
return LANDMARKS.map(
({ coordinate, ...properties }) => new Feature({ ...properties, geometry: new Point(fromLonLat(coordinate)) })
);
}
export function landmarkText(feature: FeatureLike): string {
return `${feature.get('name')} — sample observation ${feature.get('year')}`;
}icon-sprite-webgl.tsimport { ChangeDetectionStrategy, Component, signal, viewChild, type AfterViewInit } from '@angular/core';
import {
CoordinateComponent,
DefaultControlComponent,
DefaultInteractionComponent,
LayerTileComponent,
MapComponent,
SourceOsmComponent,
SourceVectorComponent,
ViewComponent,
} from 'cc-openlayers';
import { LayerWebGLVectorComponent } from 'cc-openlayers/webgl';
import type MapBrowserEvent from 'ol/MapBrowserEvent';
import { SPRITE_STYLE, landmarkFeatures, landmarkText } from './icon-sprite-webgl.shared';
@Component({
selector: 'app-icon-sprite-webgl',
imports: [
CoordinateComponent,
DefaultControlComponent,
DefaultInteractionComponent,
LayerTileComponent,
MapComponent,
SourceOsmComponent,
SourceVectorComponent,
ViewComponent,
LayerWebGLVectorComponent,
],
changeDetection: ChangeDetectionStrategy.OnPush,
templateUrl: './icon-sprite-webgl.html',
})
export class IconSpriteWebgl implements AfterViewInit {
protected readonly info = signal('');
protected readonly style = SPRITE_STYLE;
private readonly map = viewChild.required(MapComponent);
protected readonly filterType = signal('all');
private readonly source = viewChild.required(SourceVectorComponent);
ngAfterViewInit(): void {
this.source().instance.addFeatures(landmarkFeatures());
}
protected filter(event: Event): void {
this.filterType.set((event.target as HTMLSelectElement).value);
this.hide();
}
protected hover(event: MapBrowserEvent): void {
if (
event.dragging ||
this.map().instance.getView().getInteracting() ||
this.map().instance.getView().getAnimating()
)
this.hide();
else this.show(event);
}
protected show(event: MapBrowserEvent): void {
const target = event.originalEvent.target as Element | null;
const feature = target?.closest('.ol-control')
? undefined
: this.map().instance.forEachFeatureAtPixel(event.pixel, (hit) => hit);
if (!feature) return this.hide();
this.info.set(landmarkText(feature));
}
protected hide(): void {
this.info.set('');
}
} The React version uses the library's React adapter, cc-openlayers/react: each component creates the OpenLayers object it names when it mounts, updates it from its props and disposes of it when it unmounts.
icon-sprite-webgl.react.tsximport { useRef, useState, useCallback } from 'react';
import type OLMap from 'ol/Map.js';
import type MapBrowserEvent from 'ol/MapBrowserEvent.js';
import type OLVectorSource from 'ol/source/Vector.js';
import {
Coordinate,
DefaultControls,
DefaultInteractions,
Map,
OSMSource,
TileLayer,
VectorSource,
View,
} from 'cc-openlayers/react';
import { WebGLVectorLayer } from 'cc-openlayers/react/webgl';
import { SPRITE_STYLE, landmarkFeatures, landmarkText } from './icon-sprite-webgl.shared';
export function IconSpriteWebgl() {
const map = useRef<OLMap>(null);
const [info, setInfo] = useState('');
const [filterType, setFilterType] = useState('all');
const populate = useCallback((source: OLVectorSource | null) => {
if (source && source.getFeatures().length === 0) source.addFeatures(landmarkFeatures());
}, []);
const hide = () => setInfo('');
const show = (event: MapBrowserEvent) => {
const target = event.originalEvent.target as Element | null;
const feature = target?.closest('.ol-control')
? undefined
: map.current?.forEachFeatureAtPixel(event.pixel, (hit) => hit);
if (!feature) return hide();
setInfo(landmarkText(feature));
};
const hover = (event: MapBrowserEvent) => {
if (event.dragging || map.current?.getView().getInteracting() || map.current?.getView().getAnimating()) hide();
else show(event);
};
return (
<div onPointerLeave={hide}>
<Map ref={map} height="480px" onPointerMove={hover}>
<DefaultInteractions />
<DefaultControls />
<View zoom={13}>
<Coordinate x={19.9368} y={50.0614} srid="EPSG:4326" />
</View>
<TileLayer>
<OSMSource />
</TileLayer>
<WebGLVectorLayer style={SPRITE_STYLE} variables={{ filterType }}>
<VectorSource ref={populate} />
</WebGLVectorLayer>
</Map>
<div className="example-controls">
<label>
Landmark type{' '}
<select
value={filterType}
onChange={(event) => {
setFilterType(event.target.value);
hide();
}}
>
<option value="all">All</option>
<option value="museum">Museums</option>
<option value="park">Parks</option>
<option value="transport">Transport</option>
</select>
</label>
<output aria-live="polite">{info}</output>
<p className="example-hint">
Move over a marker to inspect it. Locations and observation years form an illustrative dataset.
</p>
</div>
</div>
);
}icon-sprite-webgl.shared.tsimport Feature from 'ol/Feature.js';
import type { FeatureLike } from 'ol/Feature.js';
import Point from 'ol/geom/Point.js';
import { fromLonLat } from 'ol/proj.js';
import type { Rule } from 'ol/style/flat.js';
export const LANDMARKS = [
{ name: 'National Museum', type: 'museum', year: 2019, coordinate: [19.9238, 50.0607] },
{ name: 'MOCAK', type: 'museum', year: 2020, coordinate: [19.9618, 50.0474] },
{ name: 'Planty', type: 'park', year: 2021, coordinate: [19.9395, 50.0591] },
{ name: 'Park Jordana', type: 'park', year: 2022, coordinate: [19.9113, 50.0621] },
{ name: 'Kraków Główny', type: 'transport', year: 2023, coordinate: [19.9479, 50.0675] },
{ name: 'Kraków Airport station', type: 'transport', year: 2024, coordinate: [19.8029, 50.0706] },
];
const atlas = `<svg xmlns="http://www.w3.org/2000/svg" width="96" height="32" viewBox="0 0 96 32">
<g fill="white" stroke="#263238" stroke-width="1.5">
<path d="M3 11L16 3L29 11Z M5 27V13H10V27 M14 27V13H19V27 M23 27V13H28V27 M3 29H29"/>
<path d="M48 3L38 17H43L36 24H46V29H50V24H60L53 17H58Z"/>
<rect x="69" y="3" width="22" height="23" rx="4"/>
<path d="M72 7H88V17H72Z M73 29L76 25 M87 29L84 25"/>
</g><g fill="#263238"><circle cx="74" cy="22" r="2"/><circle cx="86" cy="22" r="2"/></g></svg>`;
export const SPRITE_STYLE: Rule[] = [
{
style: {
'icon-src': `data:image/svg+xml;charset=utf-8,${encodeURIComponent(atlas)}`,
'icon-width': 96,
'icon-height': 32,
'icon-size': [32, 32],
'icon-scale': 1,
'icon-offset': ['match', ['get', 'type'], 'museum', [0, 0], 'park', [32, 0], [64, 0]],
'icon-color': ['interpolate', ['linear'], ['get', 'year'], 2019, [255, 160, 110], 2024, [180, 255, 200]],
},
filter: ['any', ['==', ['var', 'filterType'], 'all'], ['==', ['var', 'filterType'], ['get', 'type']]],
},
];
export function landmarkFeatures(): Feature<Point>[] {
return LANDMARKS.map(
({ coordinate, ...properties }) => new Feature({ ...properties, geometry: new Point(fromLonLat(coordinate)) })
);
}
export function landmarkText(feature: FeatureLike): string {
return `${feature.get('name')} — sample observation ${feature.get('year')}`;
}How the React version works
Draw an illustrative Kraków landmark dataset from one icon atlas, filter landmark types and tint symbols by sample observation year.
What both versions share
Both versions share the six illustrative landmarks, the SVG atlas, the WebGL style rules and the label formatter. Each mounted map receives its own features. A style variable selects the landmark type, while an interpolated colour reflects the sample observation year.
From Angular to React
| Angular | React |
|---|---|
| signal for selected type | useState for selected type |
| template event handlers | React event handlers |
| Angular WebGL vector layer | React WebGLVectorLayer |
Who creates, updates and disposes
Each mounted example creates fresh OpenLayers features from shared plain data. The layer consumes the shared atlas and style rules. Adapter cleanup removes the map and layers; leaving the map clears its label.
Architecture and OpenLayers mechanics
In AfterViewInit, landmark features populate the vector source of a WebGL vector layer styled by a shared sprite definition. Each feature’s category maps to source-image pixel offsets inside the local SVG atlas while its sample year interpolates icon tint colour.
Updating the dropdown mutates the filter variable and clears any active readout, while pointer hover suppresses lookups whenever the map is dragging, interacting or animating and ignores map control buttons.
How it works
- One local SVG sprite sheet supplies museum, park and transport glyphs selected via source-image pixel offsets.
- Flat WebGL expressions combine category sprite offsets with colour tints interpolated from each point’s sample year.
- Changing the category selector updates a WebGL style variable while pointer hover shows plain-text feature info.
Pitfalls
- Landmark coordinates and observation years are an illustrative demonstration fixture rather than an official historical register.
- Sprite offsets and crop sizes inside WebGL icon styles are always measured in intrinsic source-image pixels rather than scaled CSS pixels.
Related examples
The same feature in the OpenLayers examples .
Background: state and lifecycle of maps in Angular with OpenLayers, which the components of cc-openlayers take care of.