Vector data · Angular, React and OpenLayers
Seismic events from KML
Render 1,130 KML seismic events in OpenLayers as magnitude-scaled circles using extractStyles: false, a radius styleCache and hover tooltips.
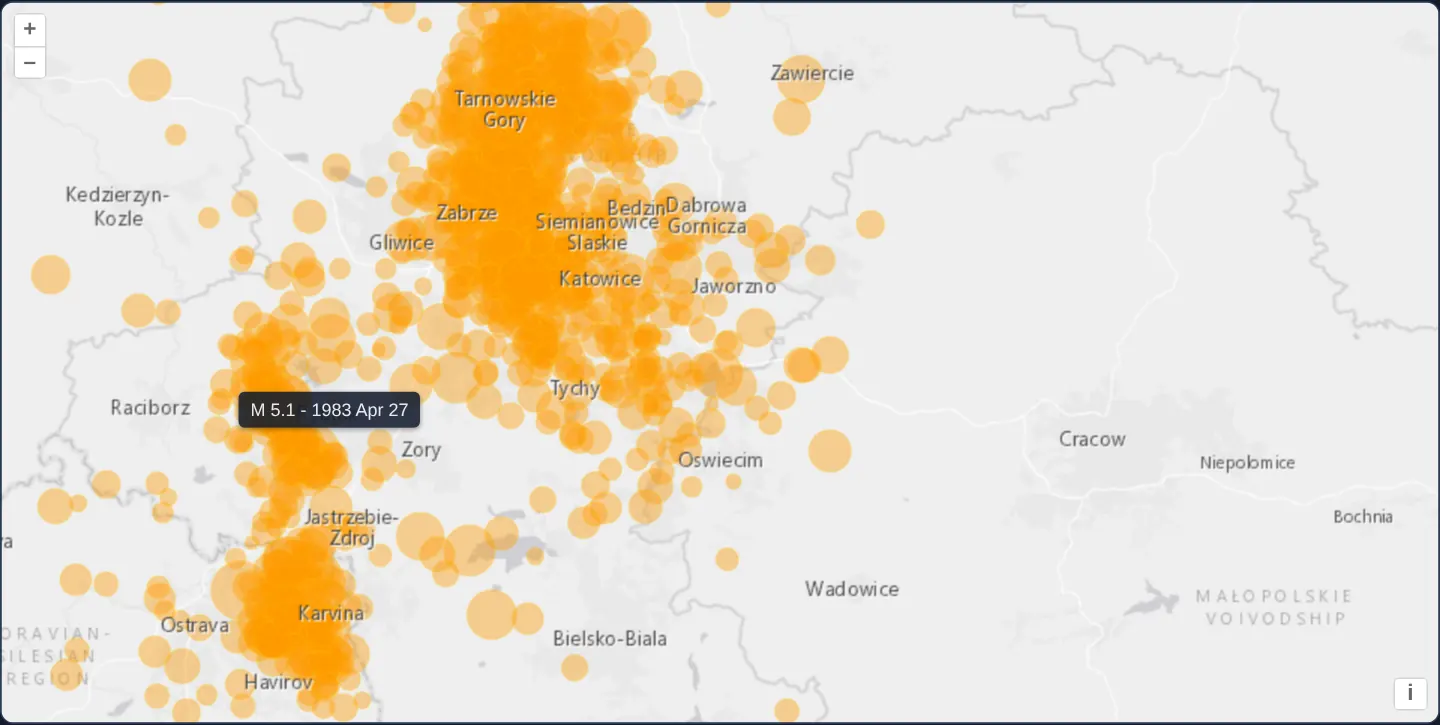
What this example shows
West of Kraków across the Upper Silesian coal basin over a light-grey basemap, 1,130 recorded seismic events from a KML catalogue appear as translucent orange circles scaled proportionally to event magnitude.
Hovering with a mouse or tapping on touch screens moves a non-blocking HTML tooltip to the event, displaying its magnitude and date string while ignoring pointer travel over map zoom controls.
When you need it
Seismic catalogues, traffic-accident logs, utility-fault reports and environmental sensor feeds contain thousands of point events where visual symbol size must immediately communicate severity.
Overriding KML’s default pushpin styles and caching OpenLayers Style instances by computed radius keeps rendering fast across more than a thousand features.
The code
The example uses cc-openlayers, my Angular component library for OpenLayers: each aol-… element creates the OpenLayers object it names, updates it from its inputs and disposes of it with the component.
kml-earthquakes.tsimport { ChangeDetectionStrategy, Component, signal, viewChild } from '@angular/core';
import type { Coordinate } from 'ol/coordinate';
import type { FeatureLike } from 'ol/Feature';
import KML from 'ol/format/KML';
import type MapBrowserEvent from 'ol/MapBrowserEvent';
import CircleStyle from 'ol/style/Circle';
import Fill from 'ol/style/Fill';
import Stroke from 'ol/style/Stroke';
import Style from 'ol/style/Style';
import {
ContentComponent,
CoordinateComponent,
DefaultControlComponent,
DefaultInteractionComponent,
LayerTileComponent,
LayerVectorComponent,
MapComponent,
OverlayComponent,
SourceImageTileComponent,
SourceVectorComponent,
ViewComponent,
} from 'cc-openlayers';
const styleCache: Record<number, Style> = {};
const styleFunction = function (feature: FeatureLike): Style {
// tremors.kml names each event by its magnitude, "M 3.4 - 1995 Mar 7"; every event has a magnitude of 2 or more.
const name: string = feature.get('name');
const magnitude = parseFloat(name.slice(2));
// Sized for the events' density: most of them are 2 to 3 and lie within some 50 km.
const radius = 4 + 6 * (magnitude - 2);
let style = styleCache[radius];
if (!style) {
style = new Style({
image: new CircleStyle({
radius: radius,
fill: new Fill({
color: 'rgba(255, 153, 0, 0.4)',
}),
stroke: new Stroke({
color: 'rgba(255, 204, 0, 0.2)',
width: 1,
}),
}),
});
styleCache[radius] = style;
}
return style;
};
/**
* The seismic events of a box around Kraków since 1978, all of them west of the city and most of them mining tremors
* of the Upper Silesian coal basin, read from a KML file, each drawn as a circle sized by its magnitude; a tooltip at
* the pointer names the event under it.
*/
@Component({
selector: 'app-kml-earthquakes',
imports: [
ContentComponent,
CoordinateComponent,
DefaultControlComponent,
DefaultInteractionComponent,
LayerTileComponent,
LayerVectorComponent,
MapComponent,
OverlayComponent,
SourceImageTileComponent,
SourceVectorComponent,
ViewComponent,
],
changeDetection: ChangeDetectionStrategy.OnPush,
template: `
<aol-map height="480px" (pointerMove)="move($event)" (olClick)="displayFeatureInfo($event)" (pointerleave)="hide()">
<aol-interaction-default />
<aol-control-defaults />
<aol-view [zoom]="9">
<aol-coordinate [x]="19.25" [y]="50.15" srid="EPSG:4326" />
</aol-view>
<aol-layer-tile>
<aol-source-imagetile
url="https://server.arcgisonline.com/ArcGIS/rest/services/Canvas/World_Light_Gray_Base/MapServer/tile/{z}/{y}/{x}"
[maxZoom]="16"
attributions="Tiles © Esri — Esri, HERE, Garmin, © OpenStreetMap contributors, and the GIS user community"
/>
</aol-layer-tile>
<aol-layer-vector [style]="style">
<aol-source-vector
url="assets/krakow/tremors.kml"
[format]="format"
attributions="Seismic events: U.S. Geological Survey"
/>
</aol-layer-vector>
<aol-layer-tile>
<aol-source-imagetile
url="https://server.arcgisonline.com/ArcGIS/rest/services/Canvas/World_Light_Gray_Reference/MapServer/tile/{z}/{y}/{x}"
[maxZoom]="16"
/>
</aol-layer-tile>
<aol-overlay positioning="bottom-center" [offset]="[0, -5]" [stopEvent]="false">
<aol-coordinate [x]="position()[0]" [y]="position()[1]" />
<aol-content>
@if (info(); as name) {
<span class="example-label">{{ name }}</span>
}
</aol-content>
</aol-overlay>
</aol-map>
`,
})
export class KmlEarthquakes {
/** The name of the event under the pointer, shown in the tooltip. */
readonly info = signal('');
readonly position = signal<Coordinate>([0, 0]);
protected readonly style = styleFunction;
protected readonly format = new KML({
extractStyles: false,
});
private readonly map = viewChild.required(MapComponent);
protected move(event: MapBrowserEvent): void {
if (event.dragging) {
this.hide();
return;
}
this.displayFeatureInfo(event);
}
protected displayFeatureInfo(event: MapBrowserEvent): void {
const target = event.originalEvent.target as Element | null;
const feature = target?.closest('.ol-control')
? undefined
: this.map().instance.forEachFeatureAtPixel(event.pixel, function (feature) {
return feature;
});
if (!feature) {
this.hide();
return;
}
this.position.set(event.coordinate);
this.info.set(feature.get('name'));
}
protected hide(): void {
this.info.set('');
}
} The React version uses the library's React adapter, cc-openlayers/react: each component creates the OpenLayers object it names when it mounts, updates it from its props and disposes of it when it unmounts.
kml-earthquakes.react.tsximport { useRef, useState } from 'react';
import type { Coordinate as OLCoordinate } from 'ol/coordinate.js';
import type { FeatureLike } from 'ol/Feature.js';
import KML from 'ol/format/KML.js';
import type OLMap from 'ol/Map.js';
import type MapBrowserEvent from 'ol/MapBrowserEvent.js';
import CircleStyle from 'ol/style/Circle.js';
import Fill from 'ol/style/Fill.js';
import Stroke from 'ol/style/Stroke.js';
import Style from 'ol/style/Style.js';
import {
Coordinate,
DefaultControls,
DefaultInteractions,
ImageTileSource,
Map,
Overlay,
TileLayer,
VectorLayer,
VectorSource,
View,
} from 'cc-openlayers/react';
const styleCache: Record<number, Style> = {};
const styleFunction = function (feature: FeatureLike): Style {
// tremors.kml names each event by its magnitude, "M 3.4 - 1995 Mar 7"; every event has a magnitude of 2 or more.
const name: string = feature.get('name');
const magnitude = parseFloat(name.slice(2));
// Sized for the events' density: most of them are 2 to 3 and lie within some 50 km.
const radius = 4 + 6 * (magnitude - 2);
let style = styleCache[radius];
if (!style) {
style = new Style({
image: new CircleStyle({
radius: radius,
fill: new Fill({
color: 'rgba(255, 153, 0, 0.4)',
}),
stroke: new Stroke({
color: 'rgba(255, 204, 0, 0.2)',
width: 1,
}),
}),
});
styleCache[radius] = style;
}
return style;
};
const format = new KML({
extractStyles: false,
});
const OFFSET = [0, -5];
/**
* The seismic events of a box around Kraków since 1978, all of them west of the city and most of them mining tremors
* of the Upper Silesian coal basin, read from a KML file, each drawn as a circle sized by its magnitude; a tooltip at
* the pointer names the event under it.
*/
export function KmlEarthquakes() {
/** The name of the event under the pointer, shown in the tooltip. */
const [info, setInfo] = useState('');
const [position, setPosition] = useState<OLCoordinate>([0, 0]);
const map = useRef<OLMap>(null);
const hide = () => setInfo('');
const move = (event: MapBrowserEvent) => {
if (event.dragging) {
hide();
return;
}
displayFeatureInfo(event);
};
const displayFeatureInfo = (event: MapBrowserEvent) => {
const target = event.originalEvent.target as Element | null;
const feature = target?.closest('.ol-control')
? undefined
: map.current?.forEachFeatureAtPixel(event.pixel, function (feature) {
return feature;
});
if (!feature) {
hide();
return;
}
setPosition(event.coordinate);
setInfo(feature.get('name'));
};
// Angular listens for pointerleave on the map's host element; in React the map gets a wrapper for it.
return (
<div onPointerLeave={hide}>
<Map ref={map} height="480px" onPointerMove={move} onClick={displayFeatureInfo}>
<DefaultInteractions />
<DefaultControls />
<View zoom={9}>
<Coordinate x={19.25} y={50.15} srid="EPSG:4326" />
</View>
<TileLayer>
<ImageTileSource
url="https://server.arcgisonline.com/ArcGIS/rest/services/Canvas/World_Light_Gray_Base/MapServer/tile/{z}/{y}/{x}"
maxZoom={16}
attributions="Tiles © Esri — Esri, HERE, Garmin, © OpenStreetMap contributors, and the GIS user community"
/>
</TileLayer>
<VectorLayer style={styleFunction}>
<VectorSource
url="assets/krakow/tremors.kml"
format={format}
attributions="Seismic events: U.S. Geological Survey"
/>
</VectorLayer>
<TileLayer>
<ImageTileSource
url="https://server.arcgisonline.com/ArcGIS/rest/services/Canvas/World_Light_Gray_Reference/MapServer/tile/{z}/{y}/{x}"
maxZoom={16}
/>
</TileLayer>
<Overlay positioning="bottom-center" offset={OFFSET} stopEvent={false}>
<Coordinate x={position[0]} y={position[1]} />
{info ? <span className="example-label">{info}</span> : null}
</Overlay>
</Map>
</div>
);
}How the React version works
Tremors from a KML file as circles sized by magnitude; a tooltip at the pointer names the event under it.
What both versions share
OpenLayers renders the map and handles the interactions; the cc-openlayers/core layer gives both adapters the same view binding (MapViewBinding) and the same conversion of coordinates from EPSG:4326 to the map's projection.
From Angular to React
| Angular | React |
|---|---|
<aol-layer-vector> with <aol-source-vector [url] [format]> | <VectorLayer> with <VectorSource url format>; the format is a module constant |
the layer's [style] | the layer's style: a function or a flat style, constant in the module |
<aol-overlay> with <aol-content> | <Overlay> with its position in useState |
(pointerleave) on the map host | onPointerLeave on a wrapping div |
(pointerMove) and viewChild of the map | onPointerMove (and onClick) on Map with useRef<OLMap>; the reading in useState |
Who creates, updates and disposes
Map creates the ol/Map in useLayoutEffect and disposes of it on unmount; each layer, source and interaction component adds its object to the parent it gets from context and removes it in its effect's cleanup, as ngOnDestroy does in Angular.
Architecture and OpenLayers mechanics
Configuring the KML parser with extractStyles: false discards default yellow pushpins so the vector layer’s own style function controls rendering—computing circle radius as 4 pixels plus 6 pixels per magnitude unit above 2 and reusing shared Style instances from styleCache.
An aol-overlay configured with [stopEvent]="false" follows (pointerMove) and (olClick) while hiding on (pointerleave) or whenever the pointer crosses an .ol-control button.
How it works
extractStyles: falsesuppresses KML pushpins so the layer’s style function can size circles dynamically by parsed magnitude.styleCachereuses one OpenLayers Style object per distinct pixel radius across all 1,130 seismic features.aol-overlaywith[stopEvent]="false"keeps the floating tooltip transparent to map pan and zoom gestures.(pointerMove)tracks desktop hover,(olClick)supports touch screens, and(pointerleave)hides the callout cleanly.
Pitfalls
- Pointer events bubbling from zoom buttons still hit the map container—skipping targets inside
.ol-controlprevents tooltips from popping up behind UI buttons. - Leaving KML style extraction enabled on an unstyled KML catalogue attaches individual default pushpin styles to every feature, overriding your layer style function.
- Because this KML encodes magnitude inside the feature name string, structured catalogues with dedicated numeric attributes should read magnitude directly from feature properties instead.
forEachFeatureAtPixelreturns the last-drawn topmost circle first, so older large circles partly covered by newer small circles are hit along their exposed outer rim.
Related examples
The same feature in the OpenLayers examples .
Background: state and lifecycle of maps in Angular with OpenLayers, which the components of cc-openlayers take care of.