Raster, GeoTIFF and WebGL · Angular, React and OpenLayers
Read five-band NumPy tiles
Decode planar multi-band scientific NumPy .npy rasters into 5-band OpenLayers DataTiles using @planet/ol-numpytiles and WebGL range styling.
What this example shows
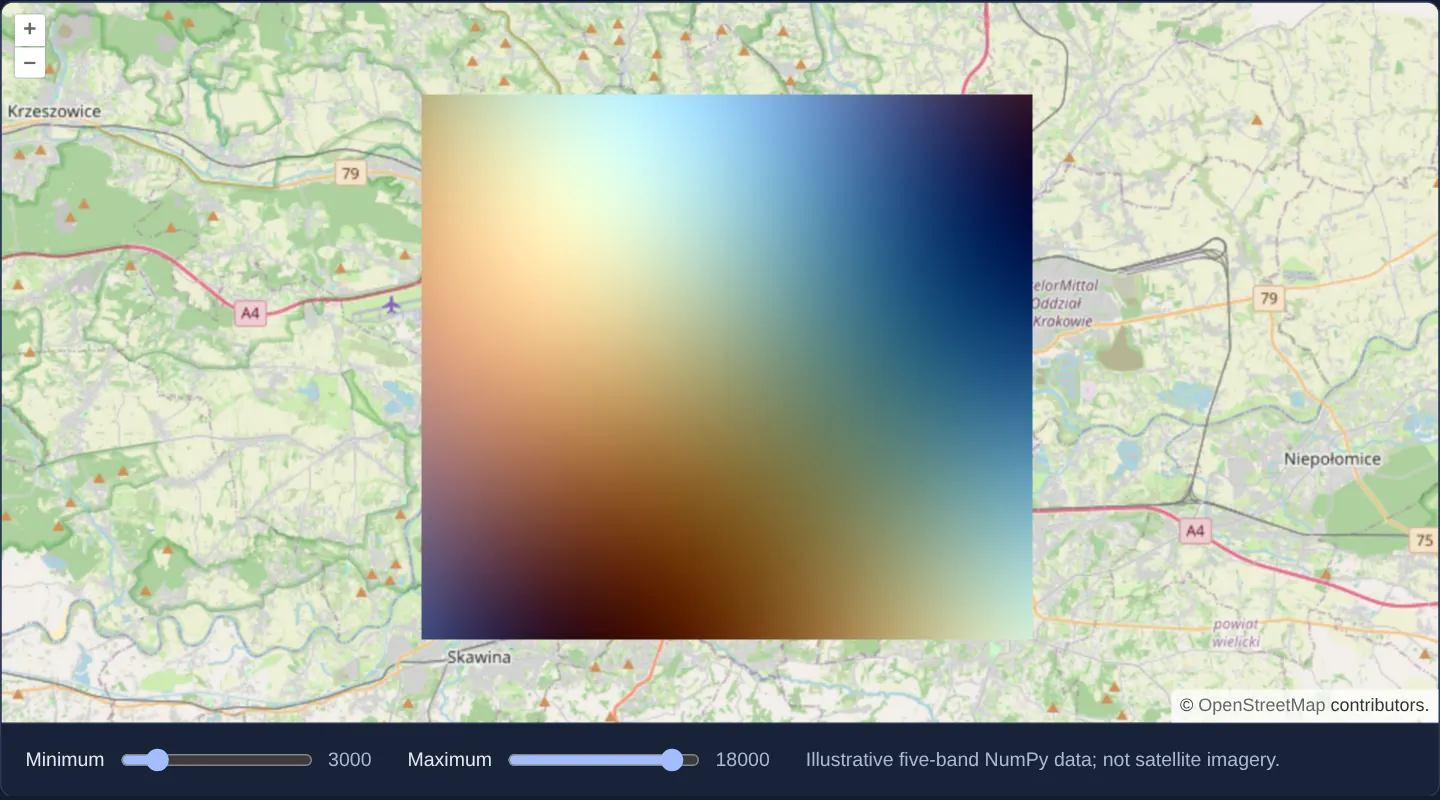
Over OpenStreetMap around Kraków, a five-band scientific raster stored in Python’s native .npy NumPy array format decodes directly in the browser into a floating-point DataTile layer styled dynamically on the GPU with interactive range controls.
When you need it
Python data-science, climate-modelling, machine-learning and remote-sensing pipelines natively export multidimensional numpy.ndarray (.npy) tiles without converting arrays into GeoTIFF or PNG first.
Decoding .npy buffers directly into OpenLayers WebGL DataTile textures bridges Python scientific backends and interactive web maps cleanly.
The code
The example uses cc-openlayers, my Angular component library for OpenLayers: each aol-… element creates the OpenLayers object it names, updates it from its inputs and disposes of it with the component.
numpy-types.tsdeclare module '@planet/ol-numpytiles' {
export function fromArrayBuffer(buffer: ArrayBuffer): { shape: number[]; data: ArrayLike<number> };
}numpytile.html<aol-map height="480px"
><aol-interaction-default /><aol-control-defaults /><aol-view [zoom]="11"
><aol-coordinate [x]="19.9368" [y]="50.0614" srid="EPSG:4326" /></aol-view
><aol-layer-tile><aol-source-osm /></aol-layer-tile
><aol-layer-webgltile [style]="style" [variables]="{ minimum: minimum(), maximum: maximum() }"
><aol-source-datatile
[loader]="loader"
[maxZoom]="0"
[transition]="0"
[tileGrid]="grid"
[bandCount]="5" /></aol-layer-webgltile
></aol-map>
<div class="example-controls">
<label
>Minimum<input
type="range"
min="0"
max="20000"
[value]="minimum()"
(input)="setValue('minimum', $event)"
/><output>{{ minimum() }}</output></label
><label
>Maximum<input
type="range"
min="0"
max="20000"
[value]="maximum()"
(input)="setValue('maximum', $event)"
/><output>{{ maximum() }}</output></label
>
<p class="example-hint">Illustrative five-band NumPy data; not satellite imagery.</p>
</div>numpytile.shared.tsimport './numpy-types';
import TileGrid from 'ol/tilegrid/TileGrid.js';
import { transformExtent } from 'ol/proj.js';
import { fromArrayBuffer } from '@planet/ol-numpytiles';
import type { Style } from 'ol/layer/WebGLTile.js';
/** Convert the planar NPY bands to the interleaved layout expected by DataTile. */
export function interleaveBands(data: ArrayLike<number>, width: number, height: number): Float32Array {
const size = width * height;
if (data.length !== size * 5) throw new Error('Expected five bands');
const result = new Float32Array(size * 5);
for (let pixel = 0; pixel < size; pixel++) {
for (let band = 0; band < 4; band++) result[pixel * 5 + band] = data[band * size + pixel];
result[pixel * 5 + 4] = data[4 * size + pixel] > 0 ? 1 : 0;
}
return result;
}
export async function loadNumpyTile(): Promise<Float32Array> {
const response = await fetch('assets/package-ports/numpytile/illustrative.npy');
if (!response.ok) throw new Error('NumPy tile could not be loaded');
const array = fromArrayBuffer(await response.arrayBuffer());
if (array.shape.join(',') !== '5,256,256') throw new Error('Unexpected NumPy tile shape');
return interleaveBands(array.data, 256, 256);
}
const band = (index: number): unknown[] => [
'interpolate',
['linear'],
['band', index],
['var', 'minimum'],
0,
['var', 'maximum'],
1,
];
export const numpyStyle: Style = {
color: ['array', band(3), band(2), band(1), ['band', 5]] as Style['color'],
variables: { minimum: 3000, maximum: 18000 },
};
export const numpyExtent = transformExtent([19.8, 49.98, 20.08, 50.14], 'EPSG:4326', 'EPSG:3857');
export const numpyGrid = new TileGrid({
extent: numpyExtent,
origin: [numpyExtent[0], numpyExtent[3]],
resolutions: [(numpyExtent[2] - numpyExtent[0]) / 256],
tileSize: 256,
});numpytile.tsimport { ChangeDetectionStrategy, Component, signal } from '@angular/core';
import {
CoordinateComponent,
DefaultControlComponent,
DefaultInteractionComponent,
LayerTileComponent,
MapComponent,
SourceDataTileComponent,
SourceOsmComponent,
ViewComponent,
} from 'cc-openlayers';
import { LayerWebGLTileComponent } from 'cc-openlayers/webgl';
import { loadNumpyTile, numpyStyle, numpyGrid, numpyExtent } from './numpytile.shared';
@Component({
selector: 'app-numpytile',
imports: [
CoordinateComponent,
DefaultControlComponent,
DefaultInteractionComponent,
LayerTileComponent,
MapComponent,
SourceDataTileComponent,
SourceOsmComponent,
ViewComponent,
LayerWebGLTileComponent,
],
templateUrl: './numpytile.html',
changeDetection: ChangeDetectionStrategy.OnPush,
})
export class Numpytile {
protected readonly loader = loadNumpyTile;
protected readonly style = numpyStyle;
protected readonly grid = numpyGrid;
protected readonly extent = numpyExtent;
protected readonly minimum = signal(3000);
protected readonly maximum = signal(18000);
protected setValue(key: 'minimum' | 'maximum', event: Event) {
const value = Number((event.target as HTMLInputElement).value);
if (key === 'minimum') this.minimum.set(Math.min(value, this.maximum() - 1));
else this.maximum.set(Math.max(value, this.minimum() + 1));
}
} The React version uses the library's React adapter, cc-openlayers/react: each component creates the OpenLayers object it names when it mounts, updates it from its props and disposes of it when it unmounts.
numpytile.react.tsximport { useState } from 'react';
import {
Coordinate,
DefaultControls,
DefaultInteractions,
Map,
View,
TileLayer,
OSMSource,
DataTileSource,
} from 'cc-openlayers/react';
import { WebGLTileLayer } from 'cc-openlayers/react/webgl';
import { loadNumpyTile, numpyStyle, numpyGrid } from './numpytile.shared';
export function Numpytile() {
const [minimum, setMinimum] = useState(3000);
const [maximum, setMaximum] = useState(18000);
return (
<>
<Map height="480px">
<DefaultInteractions />
<DefaultControls />
<View zoom={11}>
<Coordinate x={19.9368} y={50.0614} srid="EPSG:4326" />
</View>
<TileLayer>
<OSMSource />
</TileLayer>
<WebGLTileLayer style={numpyStyle} variables={{ minimum, maximum }}>
<DataTileSource
loader={loadNumpyTile}
maxZoom={0}
transition={0}
tileGrid={numpyGrid}
bandCount={5}
/>
</WebGLTileLayer>
</Map>
<div className="example-controls">
<label>
Minimum
<input
type="range"
min={0}
max={20000}
value={minimum}
onChange={(event) => setMinimum(Math.min(Number(event.target.value), maximum - 1))}
/>
<output>{minimum}</output>
</label>
<label>
Maximum
<input
type="range"
min={0}
max={20000}
value={maximum}
onChange={(event) => setMaximum(Math.max(Number(event.target.value), minimum + 1))}
/>
<output>{maximum}</output>
</label>
<p className="example-hint">Illustrative five-band NumPy data; not satellite imagery.</p>
</div>
</>
);
}numpytile.shared.tsimport './numpy-types';
import TileGrid from 'ol/tilegrid/TileGrid.js';
import { transformExtent } from 'ol/proj.js';
import { fromArrayBuffer } from '@planet/ol-numpytiles';
import type { Style } from 'ol/layer/WebGLTile.js';
/** Convert the planar NPY bands to the interleaved layout expected by DataTile. */
export function interleaveBands(data: ArrayLike<number>, width: number, height: number): Float32Array {
const size = width * height;
if (data.length !== size * 5) throw new Error('Expected five bands');
const result = new Float32Array(size * 5);
for (let pixel = 0; pixel < size; pixel++) {
for (let band = 0; band < 4; band++) result[pixel * 5 + band] = data[band * size + pixel];
result[pixel * 5 + 4] = data[4 * size + pixel] > 0 ? 1 : 0;
}
return result;
}
export async function loadNumpyTile(): Promise<Float32Array> {
const response = await fetch('assets/package-ports/numpytile/illustrative.npy');
if (!response.ok) throw new Error('NumPy tile could not be loaded');
const array = fromArrayBuffer(await response.arrayBuffer());
if (array.shape.join(',') !== '5,256,256') throw new Error('Unexpected NumPy tile shape');
return interleaveBands(array.data, 256, 256);
}
const band = (index: number): unknown[] => [
'interpolate',
['linear'],
['band', index],
['var', 'minimum'],
0,
['var', 'maximum'],
1,
];
export const numpyStyle: Style = {
color: ['array', band(3), band(2), band(1), ['band', 5]] as Style['color'],
variables: { minimum: 3000, maximum: 18000 },
};
export const numpyExtent = transformExtent([19.8, 49.98, 20.08, 50.14], 'EPSG:4326', 'EPSG:3857');
export const numpyGrid = new TileGrid({
extent: numpyExtent,
origin: [numpyExtent[0], numpyExtent[3]],
resolutions: [(numpyExtent[2] - numpyExtent[0]) / 256],
tileSize: 256,
});How the React version works
Decode a NumPy raster and adjust its displayed range with a WebGL tile style.
What both versions share
@planet/ol-numpytiles decodes a local NPY file. Four value bands and a mask become a five-band data tile.
From Angular to React
| Angular | React |
|---|---|
| Signals hold the minimum and maximum display values. | useState holds the same range with event handlers enforcing minimum below maximum. |
| An external Angular template declares the example. | JSX declares the example and its controls. |
| The Angular lifecycle releases the mounted resources. | Effect or subscription cleanup releases the mounted resources. |
Who creates, updates and disposes
Both versions decode the same synthetic NPY fixture and interleave its five bands. The map adapters create and dispose their own source and layer.
Architecture and OpenLayers mechanics
The @planet/ol-numpytiles decoder parses the binary .npy header and reports its shape and flat data; the example’s own interleaveBands step then transposes four numeric value bands plus a validity mask band into the pixel-interleaved [b1, b2, b3, b4, mask] layout expected by OpenLayers’ 5-band DataTile source and WebGLTileLayer shader expressions.
How it works
- Bundled NPY array bytes decode via @planet/ol-numpytiles, turning four planar value bands and a mask into an interleaved five-band OpenLayers data tile.
Pitfalls
- The colourful raster draped over Kraków is a synthetic multi-band test fixture designed to verify planar-to-interleaved NumPy decoding rather than real satellite measurements.
Related examples
The same feature in the OpenLayers examples .
Background: state and lifecycle of maps in Angular with OpenLayers, which the components of cc-openlayers take care of.