Printing and export · Angular, React and OpenLayers
Print the map at a chosen scale
Print an OpenLayers map of Kraków to a true cartographic scale PDF (1:10,000 to 1:500,000) using getPointResolution, scale bar and credits.
What this example shows
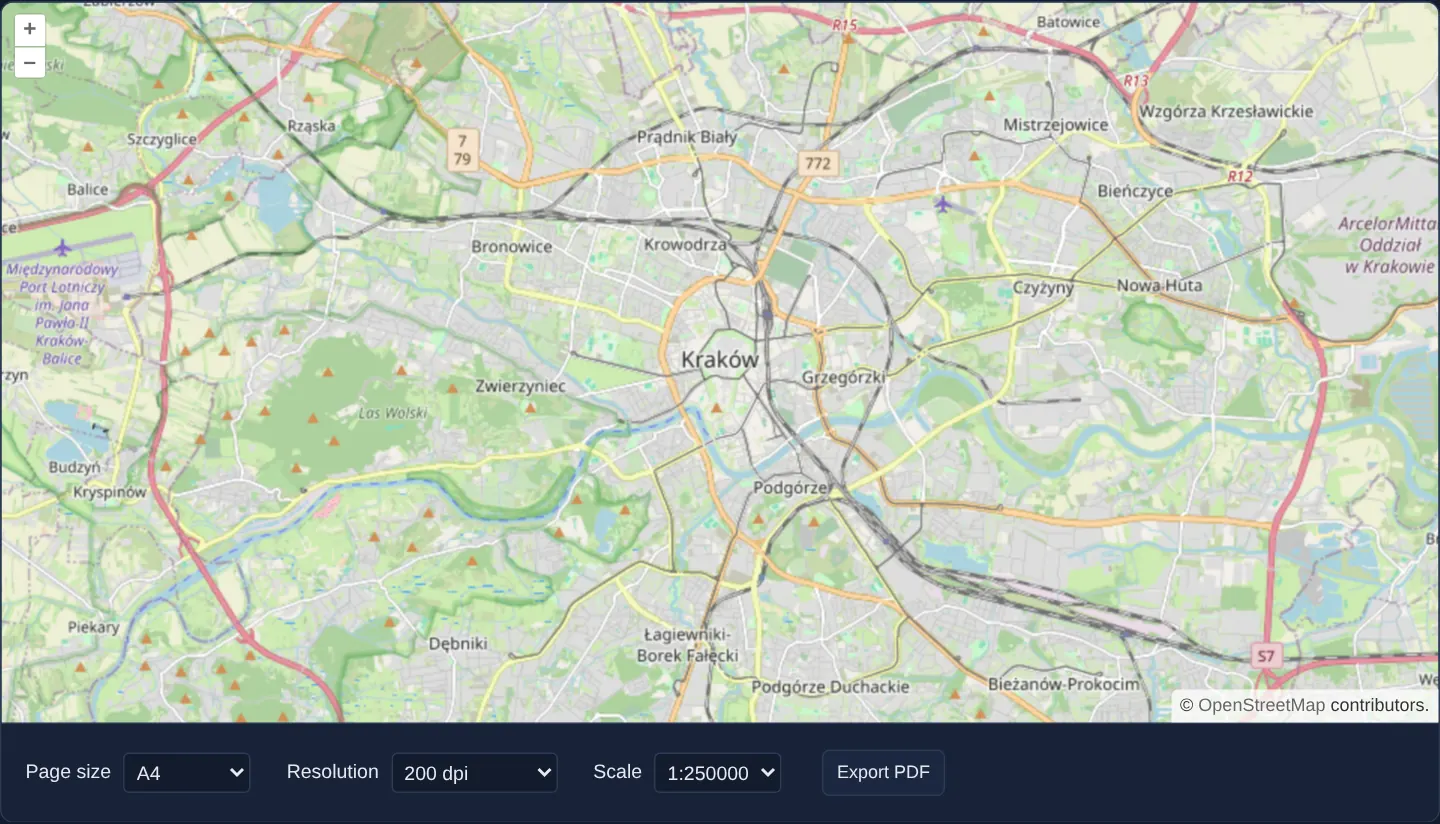
Centred on Kraków, selectors choose paper format, print DPI and an exact cartographic representative scale (1:10,000 through 1:500,000). Clicking Export PDF generates a true-to-scale map.pdf complete with a calibrated bottom-left metric scale bar and bottom-right layer attributions.
When you need it
Architectural permit filings, utility trench plans and cadastral extracts legally require true-to-scale prints (1:10,000, 1:25,000) where 1 centimetre measured with a physical ruler on paper equals an exact ground distance.
Unlike screen-extent exports (export-pdf), true-to-scale printing derives paper ground coverage strictly from paper dimensions in millimetres and the chosen 1 : S ratio, using the live view only for centre and heading.
The code
The example uses cc-openlayers, my Angular component library for OpenLayers: each aol-… element creates the OpenLayers object it names, updates it from its inputs and disposes of it with the component.
print-to-scale.shared.tsimport {
canvasToJpeg,
createImagePdf,
CSS_DPI,
drawAttribution,
drawScaleBar,
MapRenderer,
mmToPixels,
mmToPoints,
paperSize,
resolutionForScale,
type PaperName,
} from 'cc-openlayers/print';
import type { Coordinate } from 'ol/coordinate.js';
import type OlMap from 'ol/Map.js';
import { get as getProjection, getPointResolution, type ProjectionLike } from 'ol/proj.js';
/** The page sizes of the form; the larger ones take longer and need more memory. */
export const pageFormats: readonly { value: PaperName; label: string }[] = [
{ value: 'A0', label: 'A0 (slow)' },
{ value: 'A1', label: 'A1' },
{ value: 'A2', label: 'A2' },
{ value: 'A3', label: 'A3' },
{ value: 'A4', label: 'A4' },
{ value: 'A5', label: 'A5 (fast)' },
];
/** The resolutions of the form, in dots per inch. */
export const resolutions: readonly { value: number; label: string }[] = [
{ value: 72, label: '72 dpi (fast)' },
{ value: 150, label: '150 dpi' },
{ value: 200, label: '200 dpi' },
{ value: 300, label: '300 dpi (slow)' },
];
/** The scales of the form, as the denominator of 1:n. */
export const scales: readonly { value: number; label: string }[] = [500000, 250000, 100000, 50000, 25000, 10000].map(
(value) => ({ value, label: `1:${value}` })
);
export interface PrintOptions {
readonly format: PaperName;
/** Dots per inch of the picture on the page. */
readonly dpi: number;
/** The denominator of the scale 1:n. */
readonly scale: number;
}
/**
* Map units per pixel that draw the ground at `1:scale` on a page of `dpi` dots per inch around `center`. The scale
* is true on the ground there: a projection that stretches distances, such as Web Mercator away from the equator,
* gets a finer resolution.
*/
export function printResolution(scale: number, dpi: number, projection: ProjectionLike, center: Coordinate): number {
const metresPerUnit = getProjection(projection)?.getMetersPerUnit() ?? 1;
return (resolutionForScale(scale, projection, dpi) * metresPerUnit) / getPointResolution(projection, 1, center, 'm');
}
/**
* A PDF of a landscape page showing the ground around the centre of the map at the chosen scale, with a scale bar and the
* attribution of the map's layers drawn on the picture. The picture is drawn on a hidden map of the page's size in pixels, so the map on the screen
* keeps its size and its view; it supplies only the centre and the rotation.
*/
export async function mapToScaledPdf(map: OlMap, { format, dpi, scale }: PrintOptions): Promise<Uint8Array> {
const [pageWidth, pageHeight] = paperSize(format, 'landscape');
const view = map.getView();
const projection = view.getProjection();
const center = view.getCenter() ?? [0, 0];
const resolution = printResolution(scale, dpi, projection, center);
const { canvas, attributions } = await new MapRenderer(map).render({
size: [Math.round(mmToPixels(pageWidth, dpi)), Math.round(mmToPixels(pageHeight, dpi))],
center,
resolution,
rotation: view.getRotation(),
// Lines and labels keep the look they have on the screen at paper size.
symbolScale: dpi / CSS_DPI,
background: '#fff',
});
const margin = mmToPixels(10, dpi);
const context = canvas.getContext('2d') as CanvasRenderingContext2D;
// Like the attribution control of the map: small text on a half-transparent white box, lower right.
drawAttribution(context, attributions, {
x: canvas.width - margin,
y: canvas.height - margin,
maxWidth: canvas.width / 2,
fontSize: (10 * dpi) / CSS_DPI,
background: 'rgba(255, 255, 255, 0.7)',
});
drawScaleBar(context, {
x: margin,
y: canvas.height - margin,
metresPerPixel: getPointResolution(projection, resolution, center, 'm'),
maxWidth: mmToPixels(50, dpi),
fontSize: (12 * dpi) / CSS_DPI,
});
return createImagePdf([
{
width: mmToPoints(pageWidth),
height: mmToPoints(pageHeight),
jpeg: await canvasToJpeg(canvas),
imageWidth: canvas.width,
imageHeight: canvas.height,
},
]);
}
/** Offers the PDF as a file through a temporary object URL, which is revoked in the next task, so the browser can start the download first. */
export function downloadPdf(pdf: Uint8Array, fileName = 'map.pdf'): void {
const url = URL.createObjectURL(new Blob([pdf as BlobPart], { type: 'application/pdf' }));
const link = document.createElement('a');
link.href = url;
link.download = fileName;
link.click();
setTimeout(() => URL.revokeObjectURL(url));
}print-to-scale.tsimport { ChangeDetectionStrategy, Component, inject, PendingTasks, signal, viewChild } from '@angular/core';
import {
CoordinateComponent,
DefaultControlComponent,
DefaultInteractionComponent,
LayerTileComponent,
MapComponent,
SourceOsmComponent,
ViewComponent,
} from 'cc-openlayers';
import type { PaperName } from 'cc-openlayers/print';
import { downloadPdf, mapToScaledPdf, pageFormats, resolutions, scales } from './print-to-scale.shared';
/**
* Prints the map to a PDF page at a chosen scale: the map on the screen supplies only the centre and the rotation, the
* extent printed depends on the scale and the page size. The picture, with a scale bar, is drawn off-screen with the
* print module, so the map on the screen is never resized.
*/
@Component({
selector: 'app-print-to-scale',
imports: [
CoordinateComponent,
DefaultControlComponent,
DefaultInteractionComponent,
LayerTileComponent,
MapComponent,
SourceOsmComponent,
ViewComponent,
],
changeDetection: ChangeDetectionStrategy.OnPush,
template: `
<aol-map height="480px">
<aol-interaction-default />
<aol-control-defaults />
<aol-view [zoom]="12"><aol-coordinate [x]="19.9368" [y]="50.0614" srid="EPSG:4326" /></aol-view>
<aol-layer-tile><aol-source-osm /></aol-layer-tile>
</aol-map>
<div class="example-controls">
<label>
Page size
<select name="format" (change)="format.set(value($event))">
@for (option of formats; track option.value) {
<option [value]="option.value" [selected]="option.value === format()">{{ option.label }}</option>
}
</select>
</label>
<label>
Resolution
<select name="resolution" (change)="dpi.set(+value($event))">
@for (option of resolutionOptions; track option.value) {
<option [value]="option.value" [selected]="option.value === dpi()">{{ option.label }}</option>
}
</select>
</label>
<label>
Scale
<select name="scale" (change)="scale.set(+value($event))">
@for (option of scaleOptions; track option.value) {
<option [value]="option.value" [selected]="option.value === scale()">{{ option.label }}</option>
}
</select>
</label>
<button type="button" [disabled]="exporting()" (click)="exportPdf()">Export PDF</button>
</div>
`,
})
export class PrintToScale {
protected readonly formats = pageFormats;
protected readonly resolutionOptions = resolutions;
protected readonly scaleOptions = scales;
protected readonly format = signal<PaperName>('A4');
protected readonly dpi = signal(200);
protected readonly scale = signal(250000);
protected readonly exporting = signal(false);
private readonly map = viewChild.required(MapComponent);
private readonly pending = inject(PendingTasks);
protected exportPdf(): void {
this.exporting.set(true);
void this.pending.run(async () => {
try {
downloadPdf(
await mapToScaledPdf(this.map().instance, { format: this.format(), dpi: this.dpi(), scale: this.scale() })
);
} finally {
this.exporting.set(false);
}
});
}
protected value(event: Event): never {
return (event.target as HTMLSelectElement).value as never;
}
} The React version uses the library's React adapter, cc-openlayers/react: each component creates the OpenLayers object it names when it mounts, updates it from its props and disposes of it when it unmounts.
print-to-scale.react.tsximport { useRef, useState } from 'react';
import type { PaperName } from 'cc-openlayers/print';
import type OLMap from 'ol/Map.js';
import { Coordinate, DefaultControls, DefaultInteractions, Map, OSMSource, TileLayer, View } from 'cc-openlayers/react';
import { downloadPdf, mapToScaledPdf, pageFormats, resolutions, scales } from './print-to-scale.shared';
/**
* Prints the map to a PDF page at a chosen scale: the map on the screen supplies only the centre and the rotation, the
* extent printed depends on the scale and the page size. The picture, with a scale bar, is drawn off-screen with the
* print module, so the map on the screen is never resized.
*/
export function PrintToScale() {
const map = useRef<OLMap>(null);
const [format, setFormat] = useState<PaperName>('A4');
const [dpi, setDpi] = useState(200);
const [scale, setScale] = useState(250000);
const [exporting, setExporting] = useState(false);
const exportPdf = async () => {
setExporting(true);
try {
downloadPdf(await mapToScaledPdf(map.current as OLMap, { format, dpi, scale }));
} finally {
setExporting(false);
}
};
return (
<>
<Map ref={map} height="480px">
<DefaultInteractions />
<DefaultControls />
<View zoom={12}>
<Coordinate x={19.9368} y={50.0614} srid="EPSG:4326" />
</View>
<TileLayer>
<OSMSource />
</TileLayer>
</Map>
<div className="example-controls">
<label>
Page size
<select name="format" value={format} onChange={(event) => setFormat(event.target.value as PaperName)}>
{pageFormats.map((option) => (
<option key={option.value} value={option.value}>
{option.label}
</option>
))}
</select>
</label>
<label>
Resolution
<select name="resolution" value={dpi} onChange={(event) => setDpi(Number(event.target.value))}>
{resolutions.map((option) => (
<option key={option.value} value={option.value}>
{option.label}
</option>
))}
</select>
</label>
<label>
Scale
<select name="scale" value={scale} onChange={(event) => setScale(Number(event.target.value))}>
{scales.map((option) => (
<option key={option.value} value={option.value}>
{option.label}
</option>
))}
</select>
</label>
<button type="button" disabled={exporting} onClick={exportPdf}>
Export PDF
</button>
</div>
</>
);
}print-to-scale.shared.tsimport {
canvasToJpeg,
createImagePdf,
CSS_DPI,
drawAttribution,
drawScaleBar,
MapRenderer,
mmToPixels,
mmToPoints,
paperSize,
resolutionForScale,
type PaperName,
} from 'cc-openlayers/print';
import type { Coordinate } from 'ol/coordinate.js';
import type OlMap from 'ol/Map.js';
import { get as getProjection, getPointResolution, type ProjectionLike } from 'ol/proj.js';
/** The page sizes of the form; the larger ones take longer and need more memory. */
export const pageFormats: readonly { value: PaperName; label: string }[] = [
{ value: 'A0', label: 'A0 (slow)' },
{ value: 'A1', label: 'A1' },
{ value: 'A2', label: 'A2' },
{ value: 'A3', label: 'A3' },
{ value: 'A4', label: 'A4' },
{ value: 'A5', label: 'A5 (fast)' },
];
/** The resolutions of the form, in dots per inch. */
export const resolutions: readonly { value: number; label: string }[] = [
{ value: 72, label: '72 dpi (fast)' },
{ value: 150, label: '150 dpi' },
{ value: 200, label: '200 dpi' },
{ value: 300, label: '300 dpi (slow)' },
];
/** The scales of the form, as the denominator of 1:n. */
export const scales: readonly { value: number; label: string }[] = [500000, 250000, 100000, 50000, 25000, 10000].map(
(value) => ({ value, label: `1:${value}` })
);
export interface PrintOptions {
readonly format: PaperName;
/** Dots per inch of the picture on the page. */
readonly dpi: number;
/** The denominator of the scale 1:n. */
readonly scale: number;
}
/**
* Map units per pixel that draw the ground at `1:scale` on a page of `dpi` dots per inch around `center`. The scale
* is true on the ground there: a projection that stretches distances, such as Web Mercator away from the equator,
* gets a finer resolution.
*/
export function printResolution(scale: number, dpi: number, projection: ProjectionLike, center: Coordinate): number {
const metresPerUnit = getProjection(projection)?.getMetersPerUnit() ?? 1;
return (resolutionForScale(scale, projection, dpi) * metresPerUnit) / getPointResolution(projection, 1, center, 'm');
}
/**
* A PDF of a landscape page showing the ground around the centre of the map at the chosen scale, with a scale bar and the
* attribution of the map's layers drawn on the picture. The picture is drawn on a hidden map of the page's size in pixels, so the map on the screen
* keeps its size and its view; it supplies only the centre and the rotation.
*/
export async function mapToScaledPdf(map: OlMap, { format, dpi, scale }: PrintOptions): Promise<Uint8Array> {
const [pageWidth, pageHeight] = paperSize(format, 'landscape');
const view = map.getView();
const projection = view.getProjection();
const center = view.getCenter() ?? [0, 0];
const resolution = printResolution(scale, dpi, projection, center);
const { canvas, attributions } = await new MapRenderer(map).render({
size: [Math.round(mmToPixels(pageWidth, dpi)), Math.round(mmToPixels(pageHeight, dpi))],
center,
resolution,
rotation: view.getRotation(),
// Lines and labels keep the look they have on the screen at paper size.
symbolScale: dpi / CSS_DPI,
background: '#fff',
});
const margin = mmToPixels(10, dpi);
const context = canvas.getContext('2d') as CanvasRenderingContext2D;
// Like the attribution control of the map: small text on a half-transparent white box, lower right.
drawAttribution(context, attributions, {
x: canvas.width - margin,
y: canvas.height - margin,
maxWidth: canvas.width / 2,
fontSize: (10 * dpi) / CSS_DPI,
background: 'rgba(255, 255, 255, 0.7)',
});
drawScaleBar(context, {
x: margin,
y: canvas.height - margin,
metresPerPixel: getPointResolution(projection, resolution, center, 'm'),
maxWidth: mmToPixels(50, dpi),
fontSize: (12 * dpi) / CSS_DPI,
});
return createImagePdf([
{
width: mmToPoints(pageWidth),
height: mmToPoints(pageHeight),
jpeg: await canvasToJpeg(canvas),
imageWidth: canvas.width,
imageHeight: canvas.height,
},
]);
}
/** Offers the PDF as a file through a temporary object URL, which is revoked in the next task, so the browser can start the download first. */
export function downloadPdf(pdf: Uint8Array, fileName = 'map.pdf'): void {
const url = URL.createObjectURL(new Blob([pdf as BlobPart], { type: 'application/pdf' }));
const link = document.createElement('a');
link.href = url;
link.download = fileName;
link.click();
setTimeout(() => URL.revokeObjectURL(url));
}How the React version works
A map of Kraków printed as a PDF page at a chosen page size, resolution and scale, with a scale bar and the map's attribution on the page. Only the centre and the rotation come from the map on the screen; the printed extent follows from the scale and the page size.
What both versions share
OpenLayers renders the map and handles the interactions; the cc-openlayers/core layer gives both adapters the same view binding (MapViewBinding) and the same conversion of coordinates from EPSG:4326 to the map's projection. Both versions import the page sizes, resolutions and scales, printResolution, mapToScaledPdf and downloadPdf from the example's .shared.ts file, so the logic exists once. printResolution turns the scale into map units per pixel with resolutionForScale and corrects it by getPointResolution, so 1:25 000 holds on the ground at Kraków and not only at the equator of Web Mercator. MapRenderer from cc-openlayers/print draws the picture off-screen; drawScaleBar and drawAttribution from the same module add the scale bar and the attribution texts the render returns.
From Angular to React
| Angular | React |
|---|---|
signals of the page size, resolution, scale and the export in progress | useState |
viewChild.required(MapComponent) and .instance | useRef passed as ref to Map, which holds the ol/Map |
the export inside PendingTasks.run, try and finally | an async click handler with the same try and finally |
@for over the options with [selected] | map with a key and value on the select |
Who creates, updates and disposes
Map creates the ol/Map in useLayoutEffect and disposes of it on unmount; each layer, source and interaction component adds its object to the parent it gets from context and removes it in its effect's cleanup, as ngOnDestroy does in Angular. The hidden map exists only during MapRenderer.render, which creates it and disposes of it in a finally block; the object URL of the file lives until the download has started.
Architecture and OpenLayers mechanics
printResolution computes target projection resolution via resolutionForScale (from scale denominator and print DPI) divided by getPointResolution at the map centre—compensating for Web Mercator’s 1 / cos(lat) stretching.
MapRenderer renders off-screen with symbolScale set to dpi / 96, drawScaleBar paints a round-number metric bar in the lower-left corner, drawAttribution stamps active layer credits in the lower-right corner, and createImagePdf + downloadPdf save map.pdf.
How it works
printResolutioncombinesresolutionForScalewithgetPointResolutionso the chosen 1 : S ratio holds in true ground metres at the map centre.MapRendererrenders off-screen usingsymbolScale(dpi / 96) to keep physical millimetre stroke and font sizes constant across DPI settings.drawScaleBaranddrawAttributionstamp a calibrated scale bar and live rendered layer credits onto the page.createImagePdfanddownloadPdfpackage and download the finishedmap.pdf.
Pitfalls
- Skipping
getPointResolutionon a Web Mercator map prints Kraków (50° N) at roughly 1:16,000 on the ground when the user requested 1:25,000—always divide planar Mercator resolution bygetPointResolution! - Always collect attributions dynamically from the layers actually rendered into the print rather than hardcoding a single provider string.
- Rotating the map view turns the cartography on the page while keeping the stamped scale bar aligned horizontally along the bottom margin.
Related examples
The same feature in the OpenLayers examples .
Background: state and lifecycle of maps in Angular with OpenLayers, which the components of cc-openlayers take care of.