Vector data · Angular, React and OpenLayers
Population symbols for Polish towns
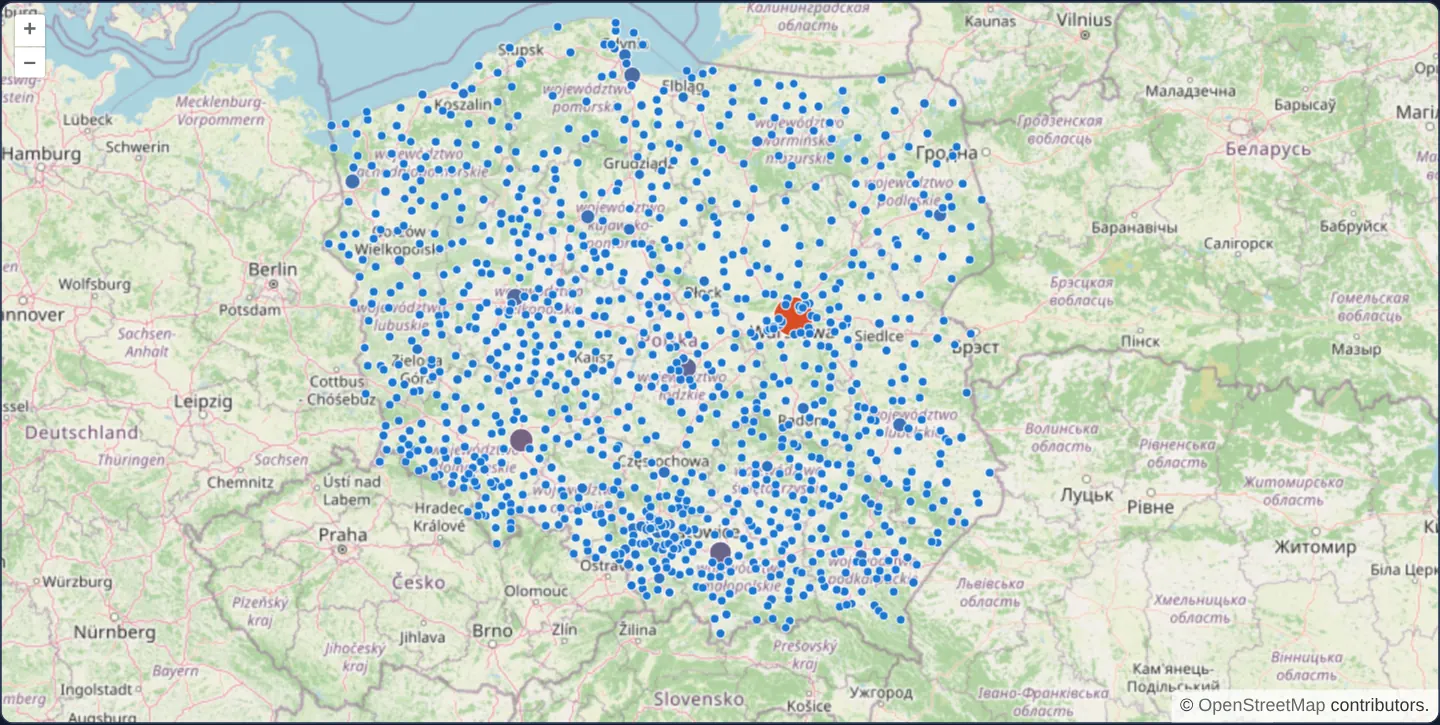
Style Polish towns by population using shared OpenLayers flat expressions and inspect town names and counts in a point-anchored HTML overlay.
What this example shows
Over OpenStreetMap, Polish towns from a local GeoJSON dataset render as circles graduated in both radius and warm colour tone by population, while hovering or clicking snaps a crisp plain-text callout badge directly onto the town’s point coordinate (and URL state stays synced via the Link interaction).
When you need it
Settlement hierarchies, store-revenue maps and regional facility overviews communicate magnitude fastest through dual-encoded proportional circles (size + colour) paired with exact numeric tooltips on hover.
Sharing pure data-driven style expressions and plain-text formatters across Angular and React keeps multi-framework GIS codebases consistent and XSS-safe.
The code
The example uses cc-openlayers, my Angular component library for OpenLayers: each aol-… element creates the OpenLayers object it names, updates it from its inputs and disposes of it with the component.
populated-places.html<aol-map height="480px" (pointerMove)="hover($event)" (olClick)="show($event)" (pointerleave)="hide()">
<aol-interaction-default />
<aol-control-defaults />
<aol-interaction-link />
<aol-view [zoom]="6"><aol-coordinate [x]="19.9368" [y]="50.0614" srid="EPSG:4326" /></aol-view>
<aol-layer-tile><aol-source-osm /></aol-layer-tile>
<aol-layer-vector [style]="style"
><aol-source-geojson url="assets/poland/towns.geojson" featureProjection="EPSG:3857"
/></aol-layer-vector>
<aol-overlay positioning="bottom-center" [offset]="[0, -8]" [stopEvent]="false"
><aol-coordinate [x]="position()[0]" [y]="position()[1]" /><aol-content>
@if (info()) {
<span class="example-label">{{ info() }}</span>
}
</aol-content></aol-overlay
>
</aol-map>populated-places.shared.tsimport type { FeatureLike } from 'ol/Feature.js';
import type { FlatStyle } from 'ol/style/flat.js';
export const POPULATION_STYLE: FlatStyle = {
'circle-stroke-color': '#ffffff',
'circle-stroke-width': 0.75,
'circle-radius': ['interpolate', ['linear'], ['get', 'population'], 1000, 3, 2000000, 14],
'circle-fill-color': ['interpolate', ['linear'], ['get', 'population'], 1000, '#1976d2', 2000000, '#e64a19'],
};
export function townText(feature: FeatureLike): string {
return `${feature.get('name')} — ${Number(feature.get('population')).toLocaleString('en-US')}`;
}populated-places.tsimport { ChangeDetectionStrategy, Component, signal, viewChild } from '@angular/core';
import {
ContentComponent,
CoordinateComponent,
DefaultControlComponent,
DefaultInteractionComponent,
LayerTileComponent,
LayerVectorComponent,
LinkInteractionComponent,
MapComponent,
OverlayComponent,
SourceGeoJSONComponent,
SourceOsmComponent,
ViewComponent,
} from 'cc-openlayers';
import type { Coordinate } from 'ol/coordinate';
import type MapBrowserEvent from 'ol/MapBrowserEvent';
import Point from 'ol/geom/Point';
import { POPULATION_STYLE, townText } from './populated-places.shared';
@Component({
selector: 'app-populated-places',
imports: [
ContentComponent,
CoordinateComponent,
DefaultControlComponent,
DefaultInteractionComponent,
LayerTileComponent,
LayerVectorComponent,
LinkInteractionComponent,
MapComponent,
OverlayComponent,
SourceGeoJSONComponent,
SourceOsmComponent,
ViewComponent,
],
changeDetection: ChangeDetectionStrategy.OnPush,
templateUrl: './populated-places.html',
})
export class PopulatedPlaces {
protected readonly info = signal('');
protected readonly position = signal<Coordinate>([0, 0]);
protected readonly style = POPULATION_STYLE;
private readonly map = viewChild.required(MapComponent);
protected hover(event: MapBrowserEvent): void {
if (event.dragging) this.hide();
else this.show(event);
}
protected show(event: MapBrowserEvent): void {
const target = event.originalEvent.target as Element | null;
const feature = target?.closest('.ol-control')
? undefined
: this.map().instance.forEachFeatureAtPixel(event.pixel, (hit) => hit);
if (!feature) return this.hide();
const geometry = feature.getGeometry();
this.position.set(geometry instanceof Point ? geometry.getCoordinates() : event.coordinate);
this.info.set(townText(feature));
}
protected hide(): void {
this.info.set('');
}
} The React version uses the library's React adapter, cc-openlayers/react: each component creates the OpenLayers object it names when it mounts, updates it from its props and disposes of it when it unmounts.
populated-places.react.tsximport { useRef, useState } from 'react';
import type OLMap from 'ol/Map.js';
import type MapBrowserEvent from 'ol/MapBrowserEvent.js';
import Point from 'ol/geom/Point.js';
import {
Coordinate,
DefaultControls,
DefaultInteractions,
GeoJSONSource,
LinkInteraction,
Map,
OSMSource,
Overlay,
TileLayer,
VectorLayer,
View,
} from 'cc-openlayers/react';
import { POPULATION_STYLE, townText } from './populated-places.shared';
const OFFSET = [0, -8];
export function PopulatedPlaces() {
const map = useRef<OLMap>(null);
const [info, setInfo] = useState('');
const [position, setPosition] = useState([0, 0]);
const hide = () => setInfo('');
const show = (event: MapBrowserEvent) => {
const target = event.originalEvent.target as Element | null;
const feature = target?.closest('.ol-control')
? undefined
: map.current?.forEachFeatureAtPixel(event.pixel, (hit) => hit);
if (!feature) return hide();
const geometry = feature.getGeometry();
setPosition(geometry instanceof Point ? geometry.getCoordinates() : event.coordinate);
setInfo(townText(feature));
};
const hover = (event: MapBrowserEvent) => {
if (event.dragging) hide();
else show(event);
};
return (
<div onPointerLeave={hide}>
<Map ref={map} height="480px" onPointerMove={hover} onClick={show}>
<DefaultInteractions />
<DefaultControls />
<LinkInteraction />
<View zoom={6}>
<Coordinate x={19.9368} y={50.0614} srid="EPSG:4326" />
</View>
<TileLayer>
<OSMSource />
</TileLayer>
<VectorLayer style={POPULATION_STYLE}>
<GeoJSONSource url="assets/poland/towns.geojson" featureProjection="EPSG:3857" />
</VectorLayer>
<Overlay positioning="bottom-center" offset={OFFSET} stopEvent={false}>
<Coordinate x={position[0]} y={position[1]} />
{info ? <span className="example-label">{info}</span> : null}
</Overlay>
</Map>
</div>
);
}populated-places.shared.tsimport type { FeatureLike } from 'ol/Feature.js';
import type { FlatStyle } from 'ol/style/flat.js';
export const POPULATION_STYLE: FlatStyle = {
'circle-stroke-color': '#ffffff',
'circle-stroke-width': 0.75,
'circle-radius': ['interpolate', ['linear'], ['get', 'population'], 1000, 3, 2000000, 14],
'circle-fill-color': ['interpolate', ['linear'], ['get', 'population'], 1000, '#1976d2', 2000000, '#e64a19'],
};
export function townText(feature: FeatureLike): string {
return `${feature.get('name')} — ${Number(feature.get('population')).toLocaleString('en-US')}`;
}How the React version works
Style Polish towns by population and inspect their names and counts with an overlay in Angular and React.
What both versions share
Both versions import the population style and label formatter from the shared file. OpenLayers reads the same local town dataset and positions an overlay at the selected point. Angular keeps the label and position in signals; React keeps them in state.
From Angular to React
| Angular | React |
|---|---|
| signal for label and position | useState for label and position |
| viewChild of MapComponent | useRef of the OpenLayers map |
| template pointer and click bindings | map event props and wrapper onPointerLeave |
Who creates, updates and disposes
The map adapter owns the map, layers, source and overlay. The selected label is cleared during dragging and when the pointer leaves. Removing the example disposes the map and its child objects; React development mounts are exercised under StrictMode.
Architecture and OpenLayers mechanics
A local GeoJSON vector source loads town features over OpenStreetMap, styled via shared POPULATION_STYLE flat expressions. On pointer move (ignoring drags and .ol-control buttons) and clicks, forEachFeatureAtPixel resolves the hit town, anchors an aol-overlay to geometry.getCoordinates() when geometry instanceof Point, and renders townText(feature) as plain text.
How it works
- Local GeoJSON town features render over OpenStreetMap using shared population-driven circle size and colour expressions.
- Both Angular and React implementations reuse identical style rules and plain-text label formatting.
- Pointer hover and clicks anchor an overlay badge onto the matched town point while drags and pointer-leave hide it.
Pitfalls
- Bundled town populations represent a static demonstration snapshot rather than a live statistical GUS feed.
- Rendering overlay text via plain text binding rather than unsanitized HTML prevents malformed feature names from injecting markup.
Related examples
The same feature in the OpenLayers examples .
Background: state and lifecycle of maps in Angular with OpenLayers, which the components of cc-openlayers take care of.