Raster, GeoTIFF and WebGL · Angular, React and OpenLayers
Animate a wind vector field
Animate speed-coloured wind streamlines and moving particles on the GPU in OpenLayers using the experimental WebGL Flow layer and DataTiles.
What this example shows
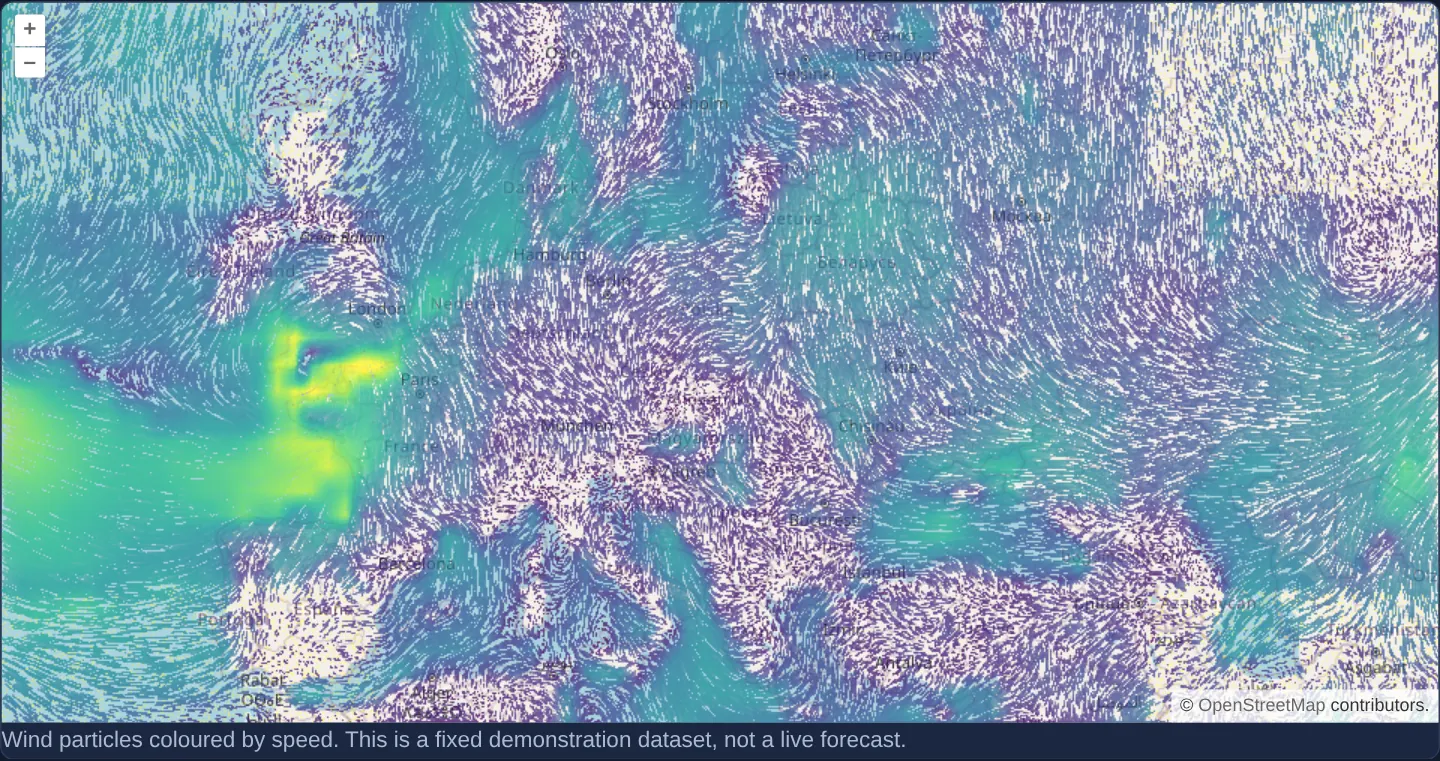
Thousands of flowing wind particles stream smoothly across OpenStreetMap on the GPU—curving along local wind direction and shifting colour from calm cool tones to high-speed warm tones.
When you need it
Meteorological wind maps, ocean-current forecasts and air-pollution dispersion models are far more intuitive when rendered as continuous animated particle streamlines (earth.nullschool-style) than static arrow grids.
OpenLayers’ WebGL Flow layer (LayerFlowComponent) simulates and colours thousands of advected particles directly in GPU framebuffers from three-band float DataTiles carrying u and v in the first two bands.
The code
The example uses cc-openlayers, my Angular component library for OpenLayers: each aol-… element creates the OpenLayers object it names, updates it from its inputs and disposes of it with the component.
wind.html<aol-map height="480px" [pixelRatio]="1">
<aol-interaction-default /><aol-control-defaults />
<aol-view [zoom]="4"><aol-coordinate [x]="19.9368" [y]="50.0614" srid="EPSG:4326" /></aol-view>
<aol-layer-tile><aol-source-osm /></aol-layer-tile>
<aol-layer-flow [options]="options" />
</aol-map>
<p class="example-hint">
Wind particles coloured by speed. This is a fixed demonstration dataset, not a live forecast.
</p>wind.shared.tsimport colormap from 'colormap';
import DataTileSource from 'ol/source/DataTile';
import type { Options } from 'ol/layer/Flow';
import { get as getProjection, toLonLat } from 'ol/proj';
import { createXYZ, wrapX } from 'ol/tilegrid';
import type { ExpressionValue } from 'ol/expr/expression';
export interface WindField {
readonly width: number;
readonly height: number;
readonly data: Uint8ClampedArray;
}
let decodedField: Promise<WindField> | undefined;
function loadWindField(): Promise<WindField> {
decodedField ??= new Promise((resolve, reject) => {
const image = new Image();
image.onload = () => {
try {
const canvas = document.createElement('canvas');
canvas.width = image.naturalWidth;
canvas.height = image.naturalHeight;
const context = canvas.getContext('2d');
if (!context) throw new Error('Wind image decoding needs a canvas');
context.drawImage(image, 0, 0);
resolve({
width: canvas.width,
height: canvas.height,
data: context.getImageData(0, 0, canvas.width, canvas.height).data,
});
} catch (error) {
reject(error);
}
};
image.onerror = () => reject(new Error('Could not load the demonstration wind field'));
image.src = new URL('assets/package-ports/wind/wind.png', document.baseURI).href;
});
return decodedField;
}
/** Decode the upstream RG velocity field, wrapping longitude and clamping latitude. */
export function sampleWind(field: WindField, lon: number, lat: number): [number, number] {
const x = (((((lon + 180) / 360) * field.width) % field.width) + field.width) % field.width;
const y = Math.max(0, Math.min(field.height - 1, ((90 - lat) / 180) * field.height));
const x1 = Math.floor(x),
x2 = (x1 + 1) % field.width;
const y1 = Math.floor(y),
y2 = Math.min(field.height - 1, y1 + 1);
const dx = x - x1,
dy = y - y1;
const band = (channel: number) => {
const at = (col: number, row: number) => field.data[(row * field.width + col) * 4 + channel];
return (
(1 - dx) * (1 - dy) * at(x1, y1) + dx * (1 - dy) * at(x2, y1) + (1 - dx) * dy * at(x1, y2) + dx * dy * at(x2, y2)
);
};
return [-21.32 + (48.12 * band(0)) / 255, -21.57 + (42.99 * band(1)) / 255];
}
/** Resample the fixed field into the three-band float tiles expected by OL Flow. */
export function createWindSource(field?: Promise<WindField>): DataTileSource {
const tileGrid = createXYZ();
const projection = getProjection('EPSG:3857');
if (!projection) throw new Error('Missing map projection');
return new DataTileSource({
tileGrid,
tileSize: 256,
projection,
bandCount: 3,
hasAlpha: false,
transition: 0,
wrapX: true,
loader: async (z, x, y) => {
const image = await (field ?? loadWindField());
const extent = tileGrid.getTileCoordExtent(wrapX(tileGrid, [z, x, y], projection));
const resolution = tileGrid.getResolution(z);
const pixels = new Float32Array(256 * 256 * 3);
for (let row = 0; row < 256; row++) {
for (let col = 0; col < 256; col++) {
const [lon, lat] = toLonLat([extent[0] + col * resolution, extent[3] - row * resolution]);
const [u, v] = sampleWind(image, lon, lat);
const offset = (row * 256 + col) * 3;
pixels[offset] = u;
pixels[offset + 1] = v;
}
}
return pixels;
},
});
}
export function flowOptions(source: DataTileSource): Options {
const maxSpeed = 20;
const colors = colormap({ colormap: 'viridis', nshades: 10, alpha: 0.9, format: 'rgba' });
const stops: ExpressionValue[] = [];
colors.forEach((color, index) => stops.push((index * maxSpeed) / (colors.length - 1), color));
return { source, maxSpeed, style: { color: ['interpolate', ['linear'], ['get', 'speed'], ...stops] } };
}wind.tsimport { ChangeDetectionStrategy, Component, DestroyRef, inject } from '@angular/core';
import {
CoordinateComponent,
DefaultControlComponent,
DefaultInteractionComponent,
LayerTileComponent,
MapComponent,
SourceOsmComponent,
ViewComponent,
} from 'cc-openlayers';
import { LayerFlowComponent } from 'cc-openlayers/webgl';
import { createWindSource, flowOptions } from './wind.shared';
@Component({
selector: 'app-wind',
imports: [
CoordinateComponent,
DefaultControlComponent,
DefaultInteractionComponent,
LayerTileComponent,
MapComponent,
SourceOsmComponent,
ViewComponent,
LayerFlowComponent,
],
changeDetection: ChangeDetectionStrategy.OnPush,
templateUrl: './wind.html',
})
export class Wind {
private readonly source = createWindSource();
protected readonly options = flowOptions(this.source);
constructor() {
inject(DestroyRef).onDestroy(() => this.source.dispose());
}
} The React version uses the library's React adapter, cc-openlayers/react: each component creates the OpenLayers object it names when it mounts, updates it from its props and disposes of it when it unmounts.
wind.react.tsximport { useState, useSyncExternalStore } from 'react';
import type { Options } from 'ol/layer/Flow';
import { Coordinate, DefaultControls, DefaultInteractions, Map, OSMSource, TileLayer, View } from 'cc-openlayers/react';
import { FlowLayer } from 'cc-openlayers/react/webgl';
import { createWindSource, flowOptions } from './wind.shared';
function createWindStore() {
let options: Options | null = null;
return {
getSnapshot: () => options,
subscribe: (listener: () => void) => {
const source = createWindSource();
options = flowOptions(source);
listener();
return () => {
source.dispose();
options = null;
};
},
};
}
export function Wind() {
const [store] = useState(createWindStore);
const options = useSyncExternalStore(store.subscribe, store.getSnapshot, () => null);
return (
<>
<Map height="480px" pixelRatio={1}>
<DefaultInteractions />
<DefaultControls />
<View zoom={4}>
<Coordinate x={19.9368} y={50.0614} srid="EPSG:4326" />
</View>
<TileLayer>
<OSMSource />
</TileLayer>
{options && <FlowLayer options={options} />}
</Map>
<p className="example-hint">
Wind particles coloured by speed. This is a fixed demonstration dataset, not a live forecast.
</p>
</>
);
}wind.shared.tsimport colormap from 'colormap';
import DataTileSource from 'ol/source/DataTile';
import type { Options } from 'ol/layer/Flow';
import { get as getProjection, toLonLat } from 'ol/proj';
import { createXYZ, wrapX } from 'ol/tilegrid';
import type { ExpressionValue } from 'ol/expr/expression';
export interface WindField {
readonly width: number;
readonly height: number;
readonly data: Uint8ClampedArray;
}
let decodedField: Promise<WindField> | undefined;
function loadWindField(): Promise<WindField> {
decodedField ??= new Promise((resolve, reject) => {
const image = new Image();
image.onload = () => {
try {
const canvas = document.createElement('canvas');
canvas.width = image.naturalWidth;
canvas.height = image.naturalHeight;
const context = canvas.getContext('2d');
if (!context) throw new Error('Wind image decoding needs a canvas');
context.drawImage(image, 0, 0);
resolve({
width: canvas.width,
height: canvas.height,
data: context.getImageData(0, 0, canvas.width, canvas.height).data,
});
} catch (error) {
reject(error);
}
};
image.onerror = () => reject(new Error('Could not load the demonstration wind field'));
image.src = new URL('assets/package-ports/wind/wind.png', document.baseURI).href;
});
return decodedField;
}
/** Decode the upstream RG velocity field, wrapping longitude and clamping latitude. */
export function sampleWind(field: WindField, lon: number, lat: number): [number, number] {
const x = (((((lon + 180) / 360) * field.width) % field.width) + field.width) % field.width;
const y = Math.max(0, Math.min(field.height - 1, ((90 - lat) / 180) * field.height));
const x1 = Math.floor(x),
x2 = (x1 + 1) % field.width;
const y1 = Math.floor(y),
y2 = Math.min(field.height - 1, y1 + 1);
const dx = x - x1,
dy = y - y1;
const band = (channel: number) => {
const at = (col: number, row: number) => field.data[(row * field.width + col) * 4 + channel];
return (
(1 - dx) * (1 - dy) * at(x1, y1) + dx * (1 - dy) * at(x2, y1) + (1 - dx) * dy * at(x1, y2) + dx * dy * at(x2, y2)
);
};
return [-21.32 + (48.12 * band(0)) / 255, -21.57 + (42.99 * band(1)) / 255];
}
/** Resample the fixed field into the three-band float tiles expected by OL Flow. */
export function createWindSource(field?: Promise<WindField>): DataTileSource {
const tileGrid = createXYZ();
const projection = getProjection('EPSG:3857');
if (!projection) throw new Error('Missing map projection');
return new DataTileSource({
tileGrid,
tileSize: 256,
projection,
bandCount: 3,
hasAlpha: false,
transition: 0,
wrapX: true,
loader: async (z, x, y) => {
const image = await (field ?? loadWindField());
const extent = tileGrid.getTileCoordExtent(wrapX(tileGrid, [z, x, y], projection));
const resolution = tileGrid.getResolution(z);
const pixels = new Float32Array(256 * 256 * 3);
for (let row = 0; row < 256; row++) {
for (let col = 0; col < 256; col++) {
const [lon, lat] = toLonLat([extent[0] + col * resolution, extent[3] - row * resolution]);
const [u, v] = sampleWind(image, lon, lat);
const offset = (row * 256 + col) * 3;
pixels[offset] = u;
pixels[offset + 1] = v;
}
}
return pixels;
},
});
}
export function flowOptions(source: DataTileSource): Options {
const maxSpeed = 20;
const colors = colormap({ colormap: 'viridis', nshades: 10, alpha: 0.9, format: 'rgba' });
const stops: ExpressionValue[] = [];
colors.forEach((color, index) => stops.push((index * maxSpeed) / (colors.length - 1), color));
return { source, maxSpeed, style: { color: ['interpolate', ['linear'], ['get', 'speed'], ...stops] } };
}How the React version works
Render moving particles over a wind vector field and colour them by speed.
What both versions share
colormap builds the colour stops. A data-tile loader samples a fixed wind dataset and supplies eastward and northward velocities.
From Angular to React
| Angular | React |
|---|---|
| The component creates the data source and disposes it through DestroyRef. | A useSyncExternalStore subscription owns the source for the committed component. |
| An external Angular template declares the example. | JSX declares the example and its controls. |
| The Angular lifecycle releases the mounted resources. | Effect or subscription cleanup releases the mounted resources. |
Who creates, updates and disposes
Both versions share wind decoding, interpolation and colour stops. The Flow adapters own particle layers; the example owns the source.
Architecture and OpenLayers mechanics
createWindSource builds a DataTile source sampling eastward (u) and northward (v) velocity components from a fixed wind raster, paired with speed colour stops generated via colormap inside flowOptions. Mounting LayerFlowComponent (cc-openlayers/webgl) runs the GPU particle advection shader, while DestroyRef disposes of the source cleanly on teardown.
How it works
- Colour stops built with colormap pair with a DataTile velocity loader supplying eastward and northward wind components to the WebGL Flow layer.
Pitfalls
- Bundled wind velocities represent a static demonstration snapshot rather than a live weather forecast, and OpenLayers’ experimental
Flowrenderer requires a WebGL-capable browser context.
Related examples
The same feature in the OpenLayers examples .
Background: state and lifecycle of maps in Angular with OpenLayers, which the components of cc-openlayers take care of.